12 Section 2. Operation
5 If prompted for MU or scaling factor, enter the information needed to convert the proper
values to dose delivered.
• If the file already contains absolute dose values for a single fraction, enter a value of 1.
• If the file contains relative values, enter MUs.
• If the file contains dose values that must be scaled, enter the appropriate scaling factor.
For example, if the file contains total dose for all fractions, the scaling factor is 1 / (num-
ber of fractions). The default scaling factor is 1.0. Pinnacle dose files are often in relative
values and require MU.
Compare Device Measured to Planned Dose
In the Analysis toolbar, select the analysis type and criteria and then click Compare. The
comparison graph shows the detectors that failed the selected comparison criteria with the
following color code:
• Red indicates failing points where Set 1 dose values are greater than Set 2 dose values.
• Blue indicates failing points where Set 1 dose values are less than Set 2 dose values.
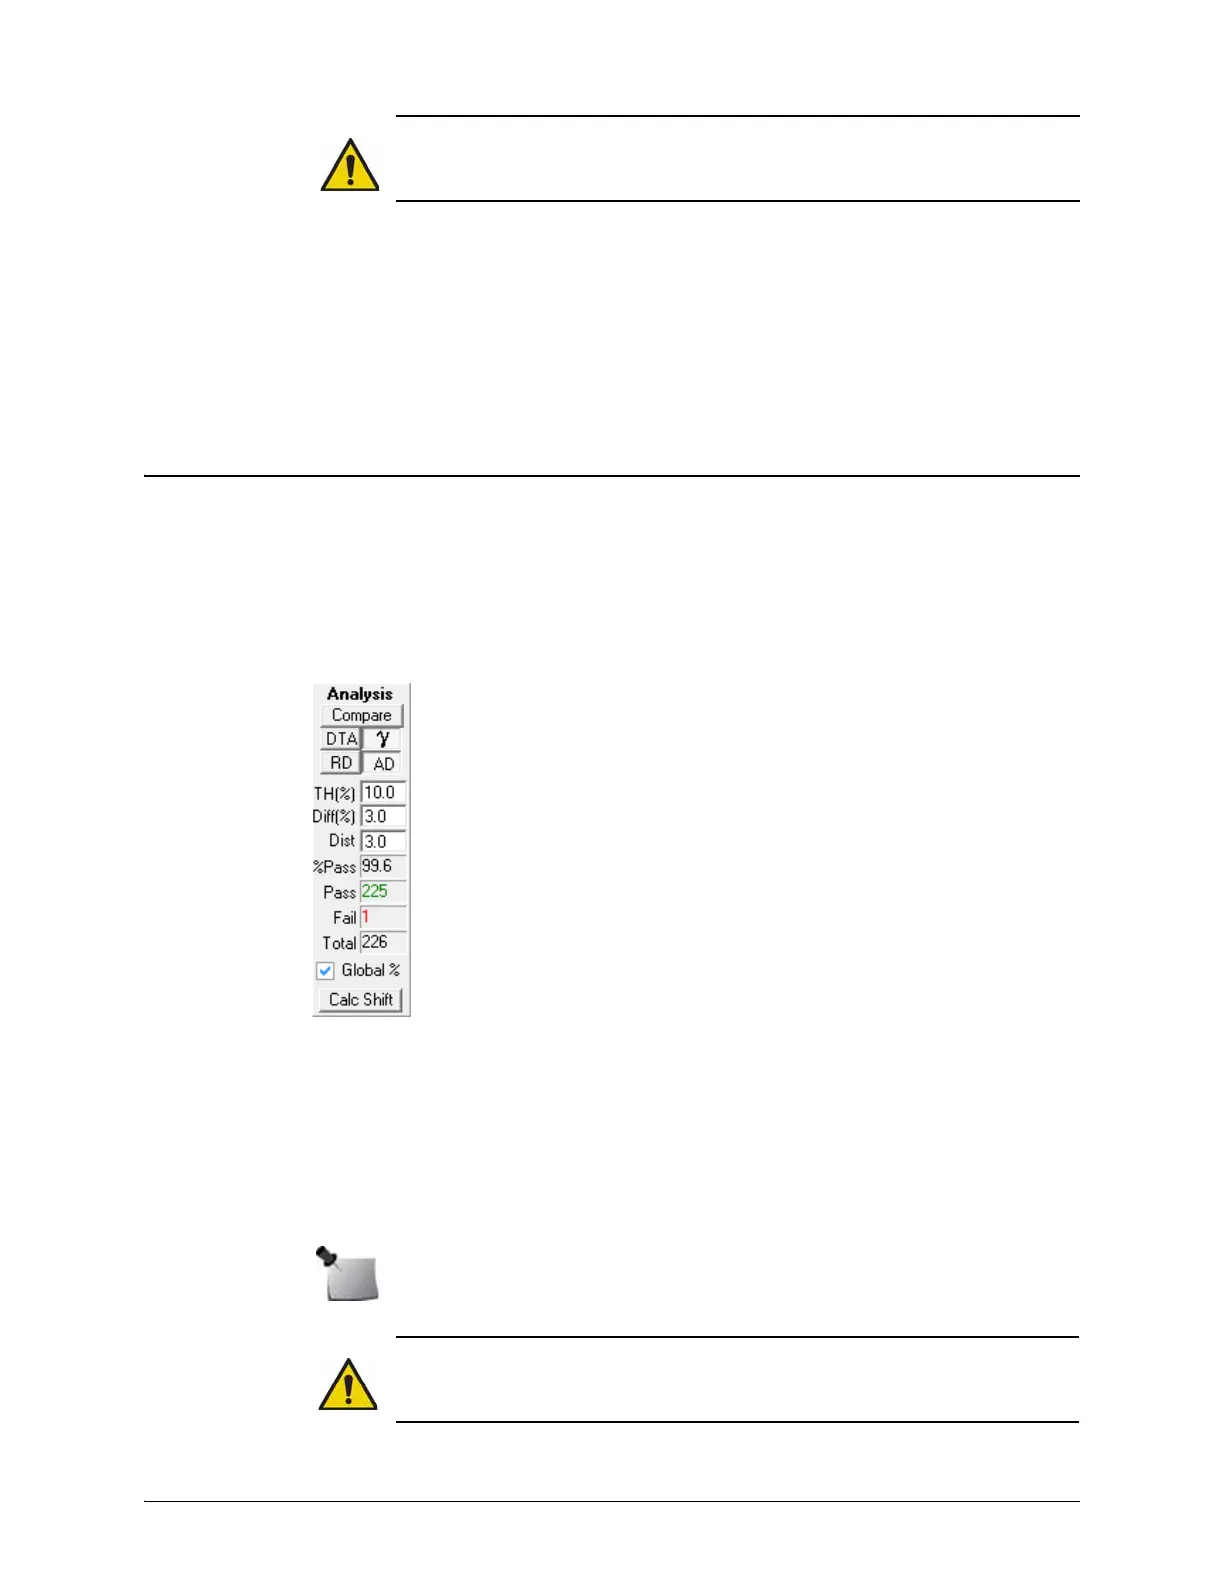
Figure 2-2. Analysis Panel Controls
WARNING: SNC Patient software interpolates planned dose data to 1 mm for DTA and
Gamma analysis. For best results in high dose gradient regions, initial grid spacing
should be ≤3 mm. If planned dose grid spacing is > 4 mm, import is prohibited.
Note: A message is displayed if the comparison reveals a significant difference in the
plan to angle calculation.
WARNING: Do not modify a patient’s treatment plan based only on the results from a
single QA device; but DO investigate the source of the error in the treatment delivery
device (TDD) or treatment planning system (TPS).
Compare button — click to compare Set 1 with Set 2.
Analysis Type:
• DTA/GC — selects Distance to Agreement (DTA) or Gradient Compensation (GC)
analysis. ‘GC’ is only displayed in the analysis toolbar if Gradient Compensation is
enabled in program preferences. GC analysis reduces dose difference by the product of
the local gradient and measurement uncertainty.
•
— selects Gamma analysis.
• RD — selects Relative Dose analysis mode.
• AD — selects Absolute Dose analysis mode.
Analysis Criteria:
• TH (%) (threshold) — minimum dose percent value that must be met in either the device
measured or planned dose data for the point to be included in the analysis.
• Diff (%) — dose difference tolerance criterion.
• Distance (mm) — distance tolerance criterion.
Note: Enable ‘Apply Measurement Uncertainty’ option in program preferences to ensure
results are consistent with expected analysis type.
Comparison Results:
• %Pass — percentage of evaluated measurement points passing criteria.
• Pass — number of measurement points passing criteria.
• Fail — number of measurement points failing criteria.
• Total — measurement points included in the analysis.
Global % (Van Dyk % difference) — available when absolute dose analysis mode is
selected. Check the box to enable Global % difference, or uncheck to select local percent
difference.
Calc Shift — calculates the best alignment between the detectors and the beam that
results in a lower number of failed points.