Document Number: MKT-70-1096 Revision 1 Page 5
SYSMEX XE-5000
TM
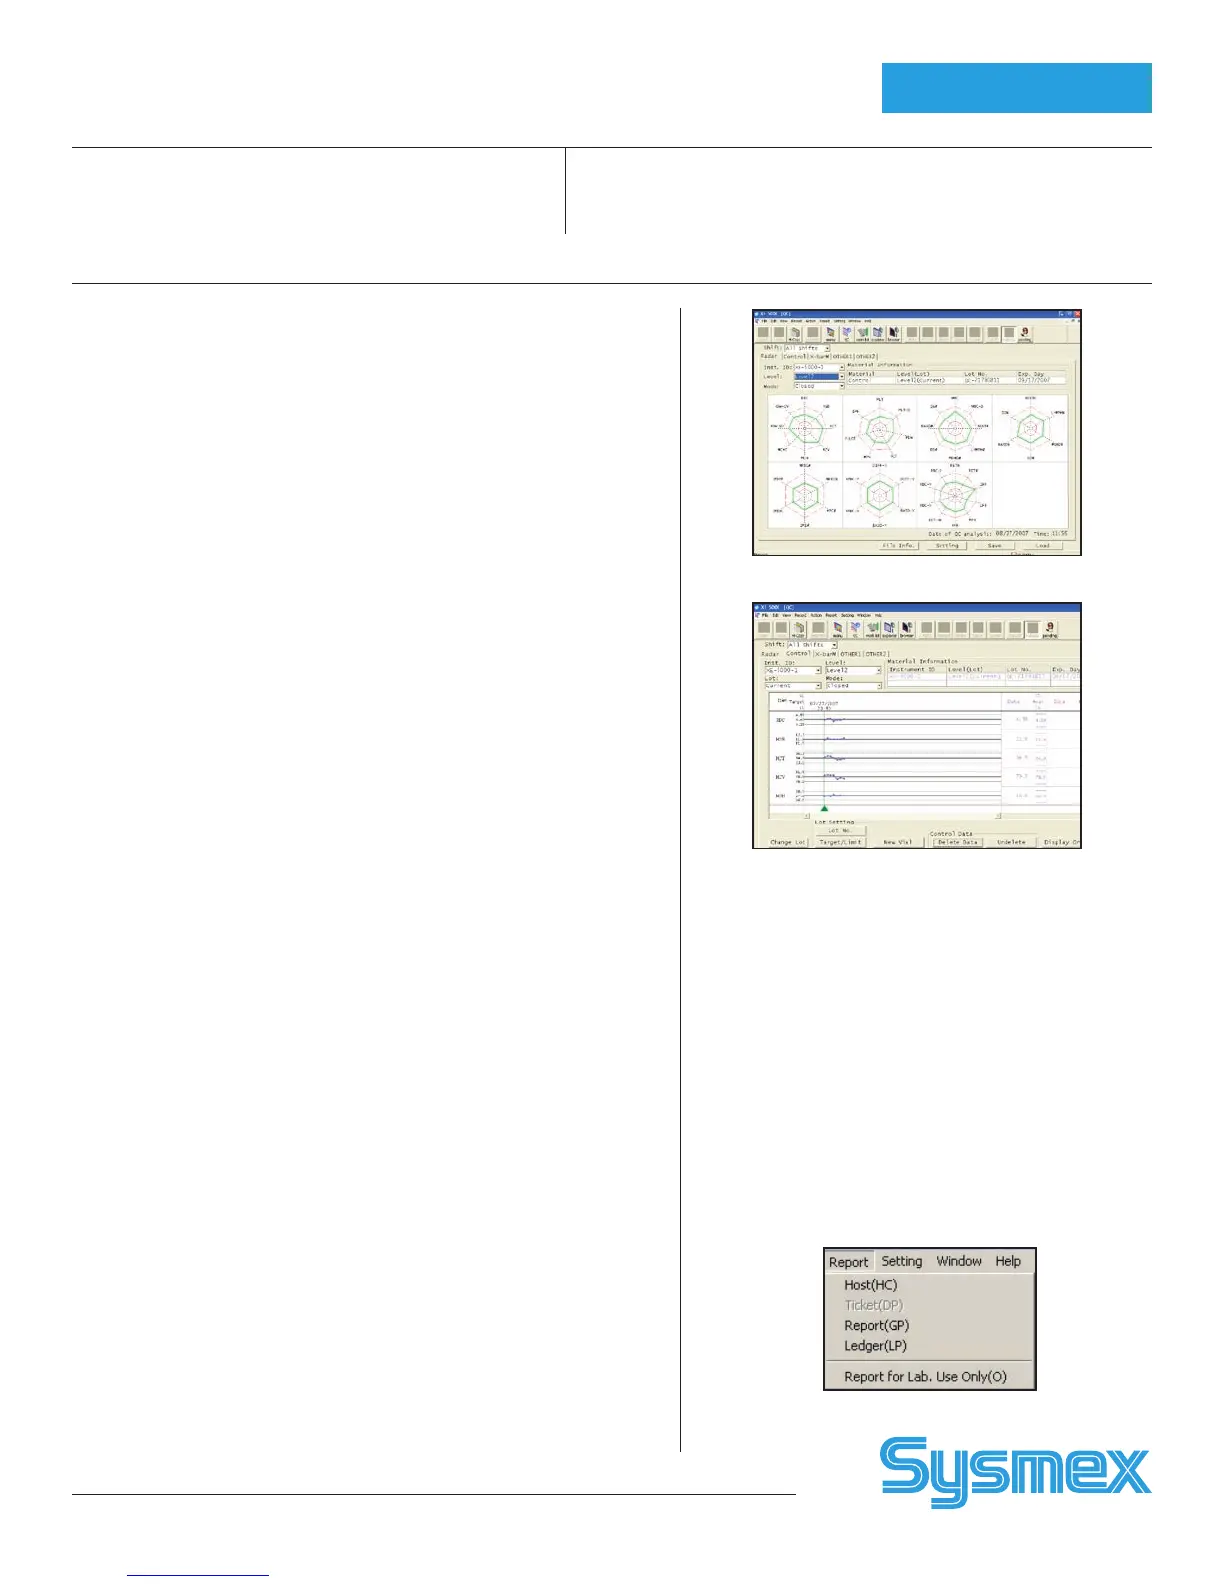
To View Radar Charts
Note: Radar Charts for Current Lot only.
1. On IPU, click on QC icon.
2. Click on Radar Tab.
3. Choose level and mode.
4. Control Data are displayed in green on Radar Chart.
5. If any parameter is outside of lower limit (inner red ring) or outside of
upper limit (outer red ring), then go to Control tab to view actual data
on L-J Charts.
To View e-CHECK L-J Charts
1. On IPU, click on QC icon and Control tab.
2. Choose Lot (Current, New, or Current + New), Level, and Mode.
3. QC chart for control is displayed.
4. To scroll down to view all QC parameters, click just above to page down
arrow on vertical cursor bar on right side of QC Chart.
5. When viewing QC, look for data outside of limits (X). Ensure data is plot-
ted and no data are missing (- - - -).
Auto Mode Error Messages L-J Limit Error
• QC Parameter > 1 x Limit %
• QC data plotted with red X, + or - next to data
• Press [HELP], [OK] to clear error message
Manual Mode Error Messages
Check Control Chart Error
• QC Parameter > 1 x Limit %
• + or - in the Judge column
• Press [OK] to accept and plot data
• QC data plotted with red X on QC Chart if plotted.
Re-analyze Control Error
• QC Parameter > 3 x Limit %
• + or - in Judge column
• Press [OK] to accept and plot data or press [Cancel] to exit and QC
data is not plotted.
• QC data plotted with red X on QC chart if plotted.
XM Limit Error
• XM plotted outside Limit %
• Investigate for systematic error or population shift
• Press [HELP], [OK] to clear error message
Erasing QC Data
Note: Delete function may require a special password.
1. On IPU, click on QC icon. Choose Control (Current, New, or
Current + New), Level, and Mode. QC chart is displayed.
2. Click on chart area. Set range of QC data to delete. Click on dark green
line and drag line to last set of data to delete. Click [Delete Data].
3. If undelete function is desired, click [Undelete]. This cancels the
previous Delete command.
4. When exiting QC, a reminder displays that deleted data will be
permanently lost. Click ‘YES’ to delete or ‘No’ to stop delete.
QC Analysis
Printing QC Report
and Resending to LIS
1. On IPU, click on QC icon. Choose Control (Current,
New, or Current + New), Level, and Mode. QC chart
is displayed.
2. Click on chart area. Set range of QC data to print by
clicking on dark green line and drag line to include all
QC data or press [Ctrl] and [A] to select all.
3. LP: After selecting range, click [Report] and select
[Ledger(LP)] to print QC data in line format.
4. GP: After selecting range, click [Report] and select
[Report(GP)] to print QC Charts.
5. HOST: After selecting range, click [Report] and
select [Host(HC)] to transmit QC data to Host (LIS)
computer.
Radar Chart
Report Menu
L-J (Levey-Jennings) Chart