EasyManua.ls Logo

Technics RS-M215

Technics RS-M215
18 pages
To Next Page IconTo Next Page
To Previous Page IconTo Previous Page
Loading...
RS-M215
Equipment:
*VTVM
*
AF
oscillator
*
ATT
*
Oscilloscope
*
Resistor
(600
Q)
*
Test
tape
(reference
blank
tape)
+-+-QZZCRA
for
Normal
-+-QZZCRX
for
CrO2
--+QZZCRZ
for
Metal
MEASUREMENT
&
ADJUSTMENT
*
eae
This
chart
indicates
the
standard
values
for
the
new
type
of
QZZCRA
when
in
use.
*
eo)
This
chart
indicates
the
standard
values
for
the
former
type
of
QZZCRA
when
in
use.
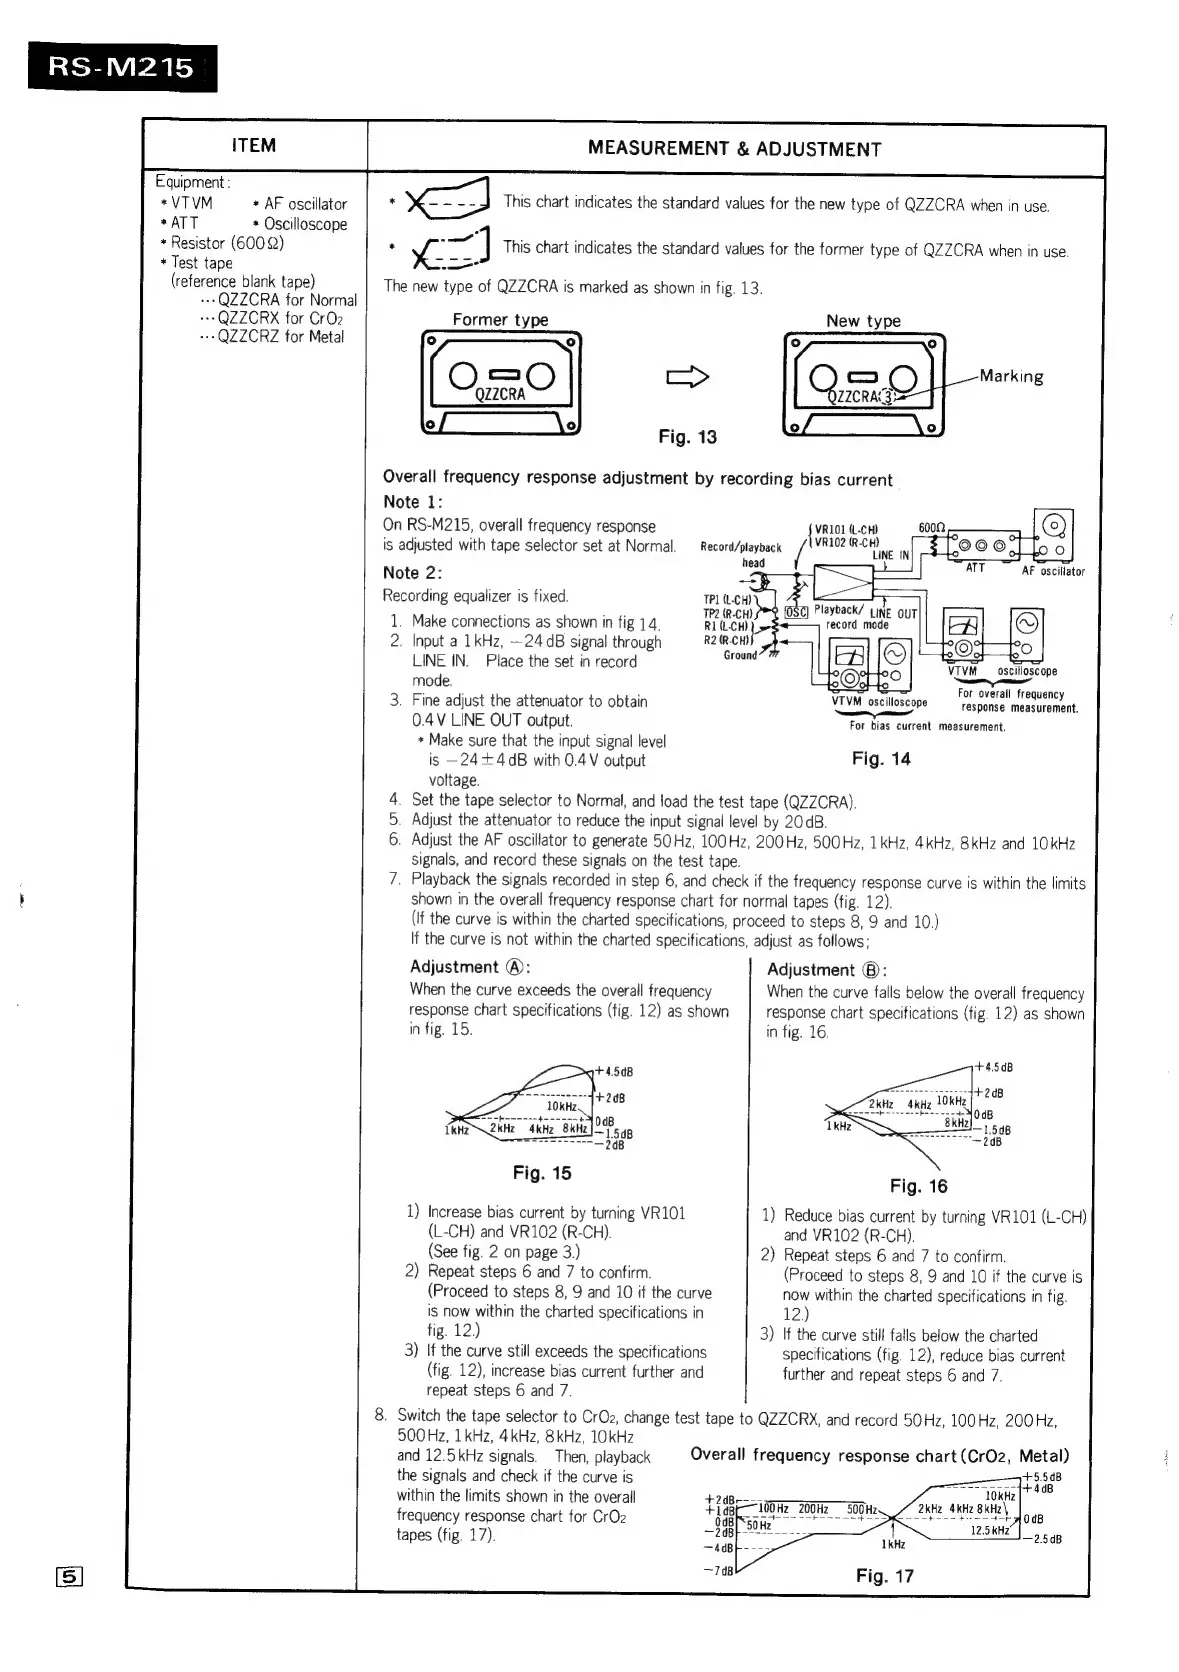
The
new
type
of
QZZCRA
is
marked
as
shown
in
fig.
13.
New
type
Qs
ZZCRAS
Former
type
Overall
frequency
response
adjustment
by
recording
bias
current
Note
1:
On
RS-M215,
overall
frequency
response
is
adjusted
with
tape
selector
set
at
Normal.
Note
2:
<>}
6000,
-
gs
[O00]
ATT
AF
oscillator
eae
(L-CH)
Record/playback
fai
LINE
IN
Recording
equalizer
is
fixed.
TP
(L-CH)
the
TP2(R-CH)
Playback/
LIne
UT
1.
Make
connections
as
shown
in
fig
14.
R1
(L-CH)
[=
record
mode
2.
Input
a
1kHz,
—24
dB
signal
through
R2
ne
roun
LINE
IN.
Place
the
set
in
record
mode.
3.
Fine
adjust
the
attenuator
to
obtain
0.4V
LINE
OUT
output.
*
Make
sure
that
the
input
signal
level
is
—24+4dB
with
0.4
V
output
voltage.
.
Set
the
tape
selector
to
Normal,
and
load
the
test
tape
(QZZCRA).
.
Adjust
the
attenuator
to
reduce
the
input
signal
level
by
20
dB.
.
Adjust
the
AF
oscillator
to
generate
50Hz,
100Hz,
200Hz,
500Hz,
1
kHz,
4kHz,
8kHz
and
10kHz
signals,
and
record
these
signals
on
the
test
tape.
7,
Playback
the
signals
recorded
in
step
6,
and
check
if
the
frequency
response
curve
is
within
the
limits
shown
in
the
overall
frequency
response
chart
for
normal
tapes
(tig.
12).
(If
the
curve
is
within
the
charted
specifications,
proceed
to
steps
8,
9
and
10.)
If
the
curve
is
not
within
the
charted
specifications,
adjust
as
follows:
Adjustment
@):
Adjustment
®):
When
the
curve
exceeds
the
overall
frequency
When
the
curve
falls
below
the
overall
frequency
response
chart
specifications
(fig.
12)
as
shown
response
chart
specifications
(tig.
12)
as
shown
in
fig.
15.
in
fig.
16.
VIVM
os
cilloscope
For
overall
frequency
response
measurement.
3
VIVM
oscilloscope
For
bias
current
measurement.
Fig.
14
ome
==
-b-----~
$-----~
+
2kHz
4kHz
8kHz
1)
Reduce
bias
current
by
turning
VR101
(L-CH)
and
VR102
(R-CH).
2)
Repeat
steps
6
and
7
to
confirm.
(Proceed
to
steps
8,
9
and
10
if
the
curve
is
now
within
the
charted
specifications
in
fig.
12)
3)
If
the
curve
still
falls
below
the
charted
specifications
(fig.
12),
reduce
bias
current
further
and
repeat
steps
6
and
7.
1)
Increase
bias
current
by
turning
VR101
(L-CH)
and
VR102
(R-CH).
(See
fig.
2
on
page
3.)
2)
Repeat
steps
6
and
7
to
confirm.
(Proceed
to
steps
8,
9
and
10
if
the
curve
is
now
within
the
charted
specifications
in
fig.
12.)
3)
If
the
curve
still
exceeds
the
specitications
(fig.
12),
increase
bias
current
further
and
repeat
steps
6
and
7.
8.
Switch
the
tape
selector
to
CrOz,
change
test
tape
to
QZZCRX,
and
record
50
Hz,
100
Hz,
200
Hz,
500Hz,
1
kHz,
4kHz,
8kHz,
10kHz
and
12.5kHz
signals.
Then,
playback
the
signals
and
check
if
the
curve
is
within
the
limits
shown
in
the
overall
frequency
response
chart
for
CrOz
0”B
tapes
(fig.
17).
Overall
frequency
response
chart
(CrOz,
Metal)
100HZ 200Hz
—_500Hz
4
Shaan
poe

Related product manuals