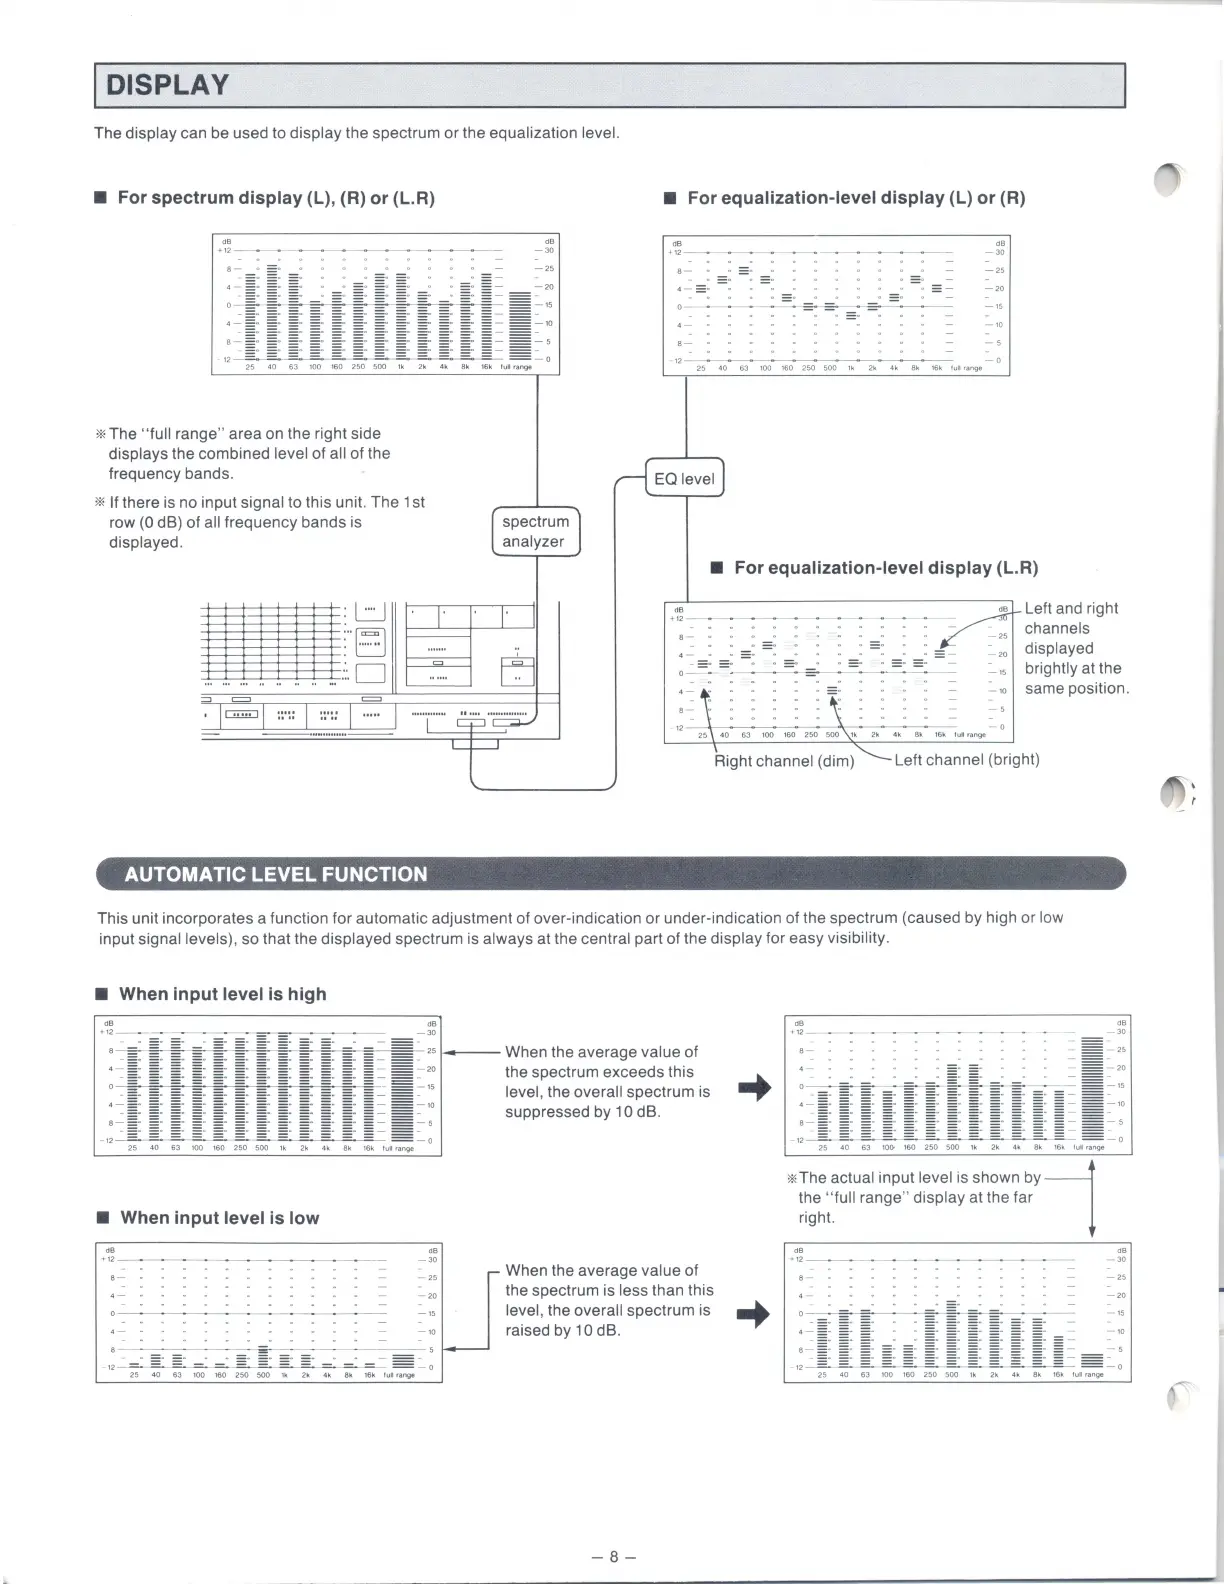
DISPLAY
The display can be used to display the spectrum
or
the equalization level.
• For
spectrum
display
(L), (R)
or
(L.R)
OB
+12 - · - ·
* The
"full
range" area on the right side
displays the combined level of all of the
frequency bands.
* If there is no input signal to this unit. The 1st
row
(0 dB) of all frequency bands is
displayed.
OB
- 30
[
spectrum
1
analyzer
• For equalization-level
display
(l)
or
(R)
OB
.,
_
~-~------
--
--
4
-=
=: : : : == -
o--
---
=---=-
-
-=
---
-
a-
..
..
.. .. ..
OB
-
30
-
25
-20
-"
----:-:-c
c:--
:::-=--c:::-~--=---::----=
---:,----,:--
=-:
- 0
25 40
63
100 160 250 5
00
l k
2k
4k
8k
16
k
lull
range
rl
EQievel
J
•
For
equalization-level
display
(L.R)
--
-
~~
+
~
:-
_
-
:
_
:_
:--
:
-=-
·
=-
=- -=
-=-=-=-
~
-
OB
_: _: =: =· _
..
: : == =: =: =: = -
-2
0
o- -
--
- -
=-
--
-
05
Left and right
channels
displayed
brightly
at the
same position.
- 5
·
1=
1:
:·
::1::·::
1
·""
""
"j
"""
C:
'
p
"
~
12
25
\ 40
63
1
00
16
0
250
500
'x
k 2k
4
~
8k 16k lui r
ange
-
0
Right channel
(dim)"----
Left channel (bright)
AUTOMATIC LEVEL FUNCTION
This unit incorporates a function for automatic adjustment of over-indication
or
under-indication of the spectrum (caused
by
hi
gh
or low
input signal levels), so that the displayed spectrum is always at the central part of the display for easy visibility.
• When
input
level
is
high
OB
.,
OB
-
30
a
~
-
~
=
~
=
~
-
~
=
~
=
~
=
~
::
=
~
=
~
-
~
_ =
:=
~
25
~When
the average value of
•
-::
~
:
~
:
~
:
~
:
~
:
~
:
~
:
~
:
~
:
~
:
~
:
~
=
::-
" the spectrum exceeds this
o _
~
-
;;;. ;;;. ;;;.
;;;
.
;;;
.
;;;
. ;;;. ;;;. ;;;.
;;;
. ;;; ..:
::-
05
level, the overall spectrum is
·
-::
~
:
~
:
~
:
~
:
~
:
~
:
~
:
~
:
~
:
~
:
~
:
~
=
::-
" suppressed by 10 dB.
a
-::
~
:
~
:
~
:
~
:
~
:
~
:
~
:
~
:
~
:
~
:
~
:
~
=
::-
s
~~~~~
~
~~-=~~~=-=-
==
-
o
25 40 63 1
00
160 2
50
5
00
lk 2 k 4k
Bk
16 k
tu
l r
ange
• When
input
level
is
low
OB
+
"
-~-----
-
------
dB
- 30
-==--'
-
=-c
-
=-=---=-·
~
==-
·
~=
=·
--=
=
,__·
~=
,..·
-=-
~-=
~
= -0
25
40
~
1
00
~
2
50
~
lk
~
4k
6k
-
·~~~
When the average value of
the spectrum is
less than this
level, the overall spectrum is
raised by 1
0 dB.
~8
~
dB
., _
__
-
dB
-
30
8 - =
=-
25
4 - • - - =
=-2
0
-=
---;;;---;;-
~
-=-=
--
- - - -
05
:
~
~
~
~
~
~
~
~
~
~
~
~
~
~
~
~
~
~
~
~
~
~
~
~
~
~:
-=· = · = · = · = · =-=-= · = · =- = · = -
.::_o
25
40
63
100
160 250 5
00
lk
2k
4k
8k
16 k
tuM
range
* The actual input level is shown
b
y~
the " full range" display at the far
right.
dB
+
"
---------
-
-~-
-
4
~
~
=
~
=
~
:
. :
~
=
~
=
~
=
~
=
~
=
~
=
=-
dB
- 30
- 25
-05
e
-
~
-
~
-
~
-
~
-
~
-
~
-
~
-
~-
~
-
~
-
~
-
~
-
_ - 5
- = - =·
=·
= · = - =· =· =· =·
=·
= · = - -
=-
o
25 40
63
1
00
1
60
250
500
1k
2k 4k 8k
16k
tuM
ran{Jf!
 Loading...