Function quantity X
Function quantity Y
Function quantity Z
You can specify a separate function quantity for each value.
A wide range of function quantities are available, which are applied
together with their unit and their decimal places.
No. X values
No. Y values
Define the number of values in each case. Up to 10 values can be
specified per axis (resulting in up to 10x10 = 100 defined Z values)
X values
Y values
Z values
Sub-menus for entering the X and Y values and the corresponding
Z values
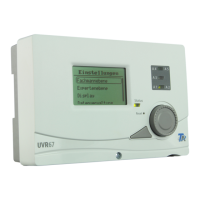
Example: The Z values should be offset values determined by the outside temperature and wind
speed:
X1 = -20 °C, X2 = +20 °C, Y1 = 10 km/h
The corresponding Z values are 4.0 and 1.0 K respectively
Tapping the arrow causes the next Y value to
be displayed.
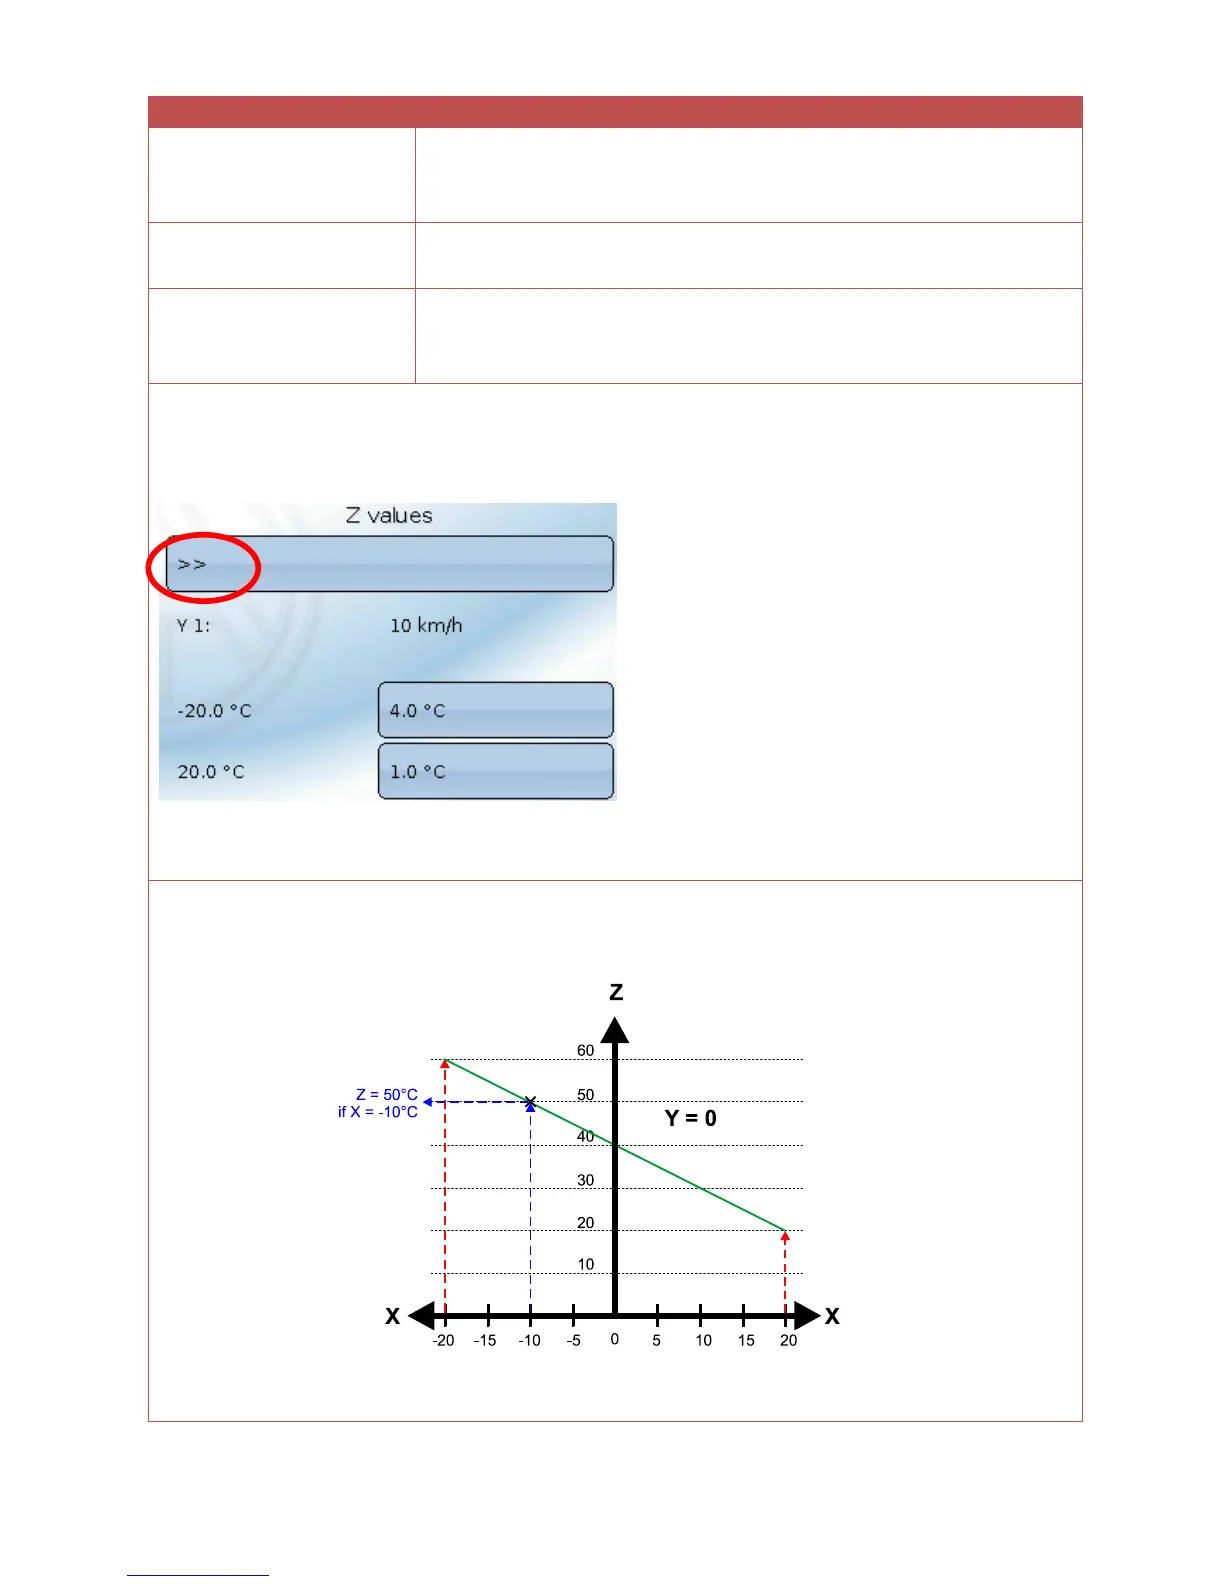
➢ If the number of Y values is set to 1, the result is a 2D curve.
➢ If only 2 X values and 1 Y value are defined, the result is a straight 2D line.
Example:
 Loading...