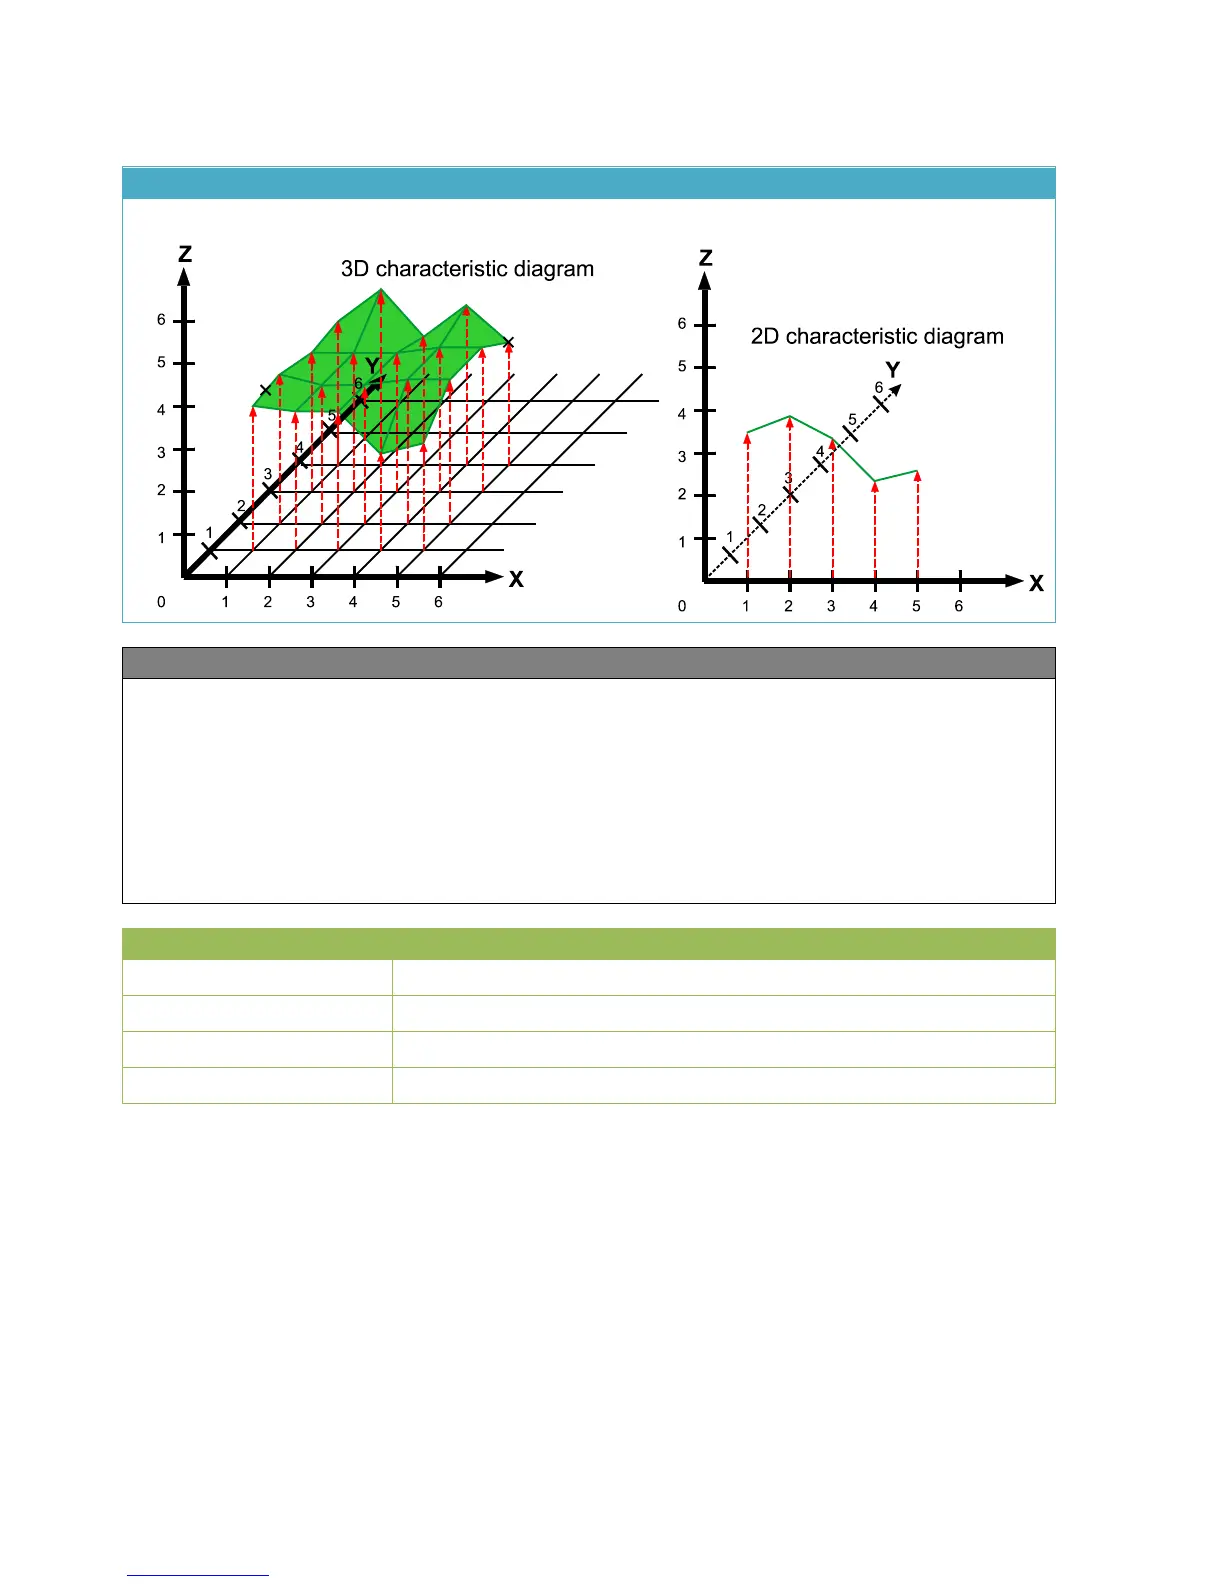
The Curve function allows a Z value to be assigned to X and Y values (3D plot). These values can
also be signed as negative values.
In the example in the standard diagram, 20 Z values were defined for 5 X values and 4 Y values.
If only 1 Y value is defined (standard diagram example: Y = 0), a 2D curve will be generated.
The intermediate values between the defined points are interpolated by the function. There is no
extrapolation of values outside the defined range. If the point lies beyond the defined points, the
output will indicate the height of the point where it exited the 3D plot or 2D curve.
Separate function quantities can be specified for X, Y and Z values.
 Loading...