284
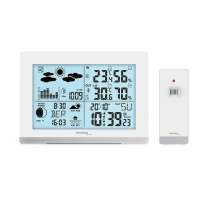
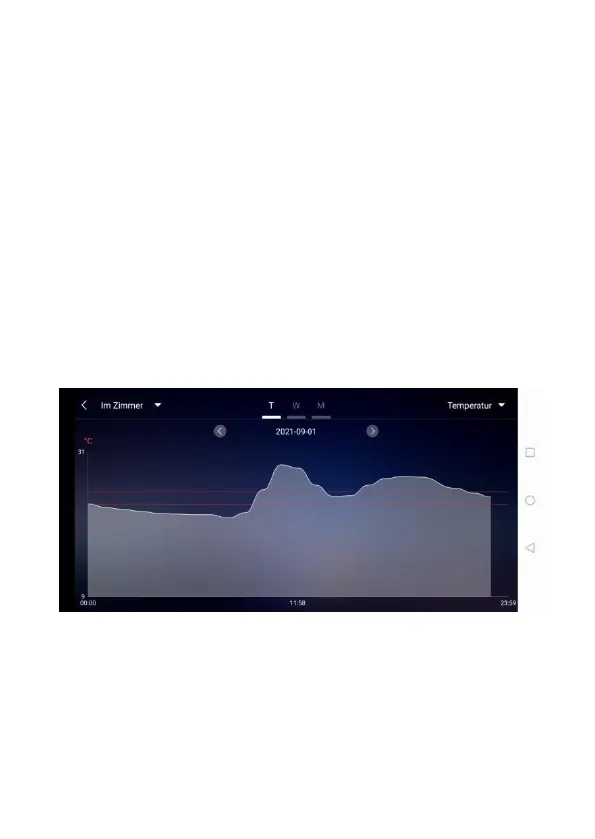
can choose to view the data chart of the base
station or wireless remote sensor
Click on the "T" (day), "W" (week) and "M"
(month) boxes on the top middle of the <
Data chart display >, and you can choose to
view the daily, weekly and monthly data
charts, Slide the screen to the left or right to
view data charts at different times.
Click the "Temperature", "Humidity" and
"Air pressure" on the top right side of the
screen and select the historical chart record
of temperature, humidity, or air pressure