4. Use the available fields to refine the measurement conditions. Displayed fields depend on the measurement. Selection
changes take effect immediately. Selection changes can also change fields in other panels.
5. Tap the Help button on the menu title for more information on this menu's settings.
6. Tap outside the menu to close the menu.
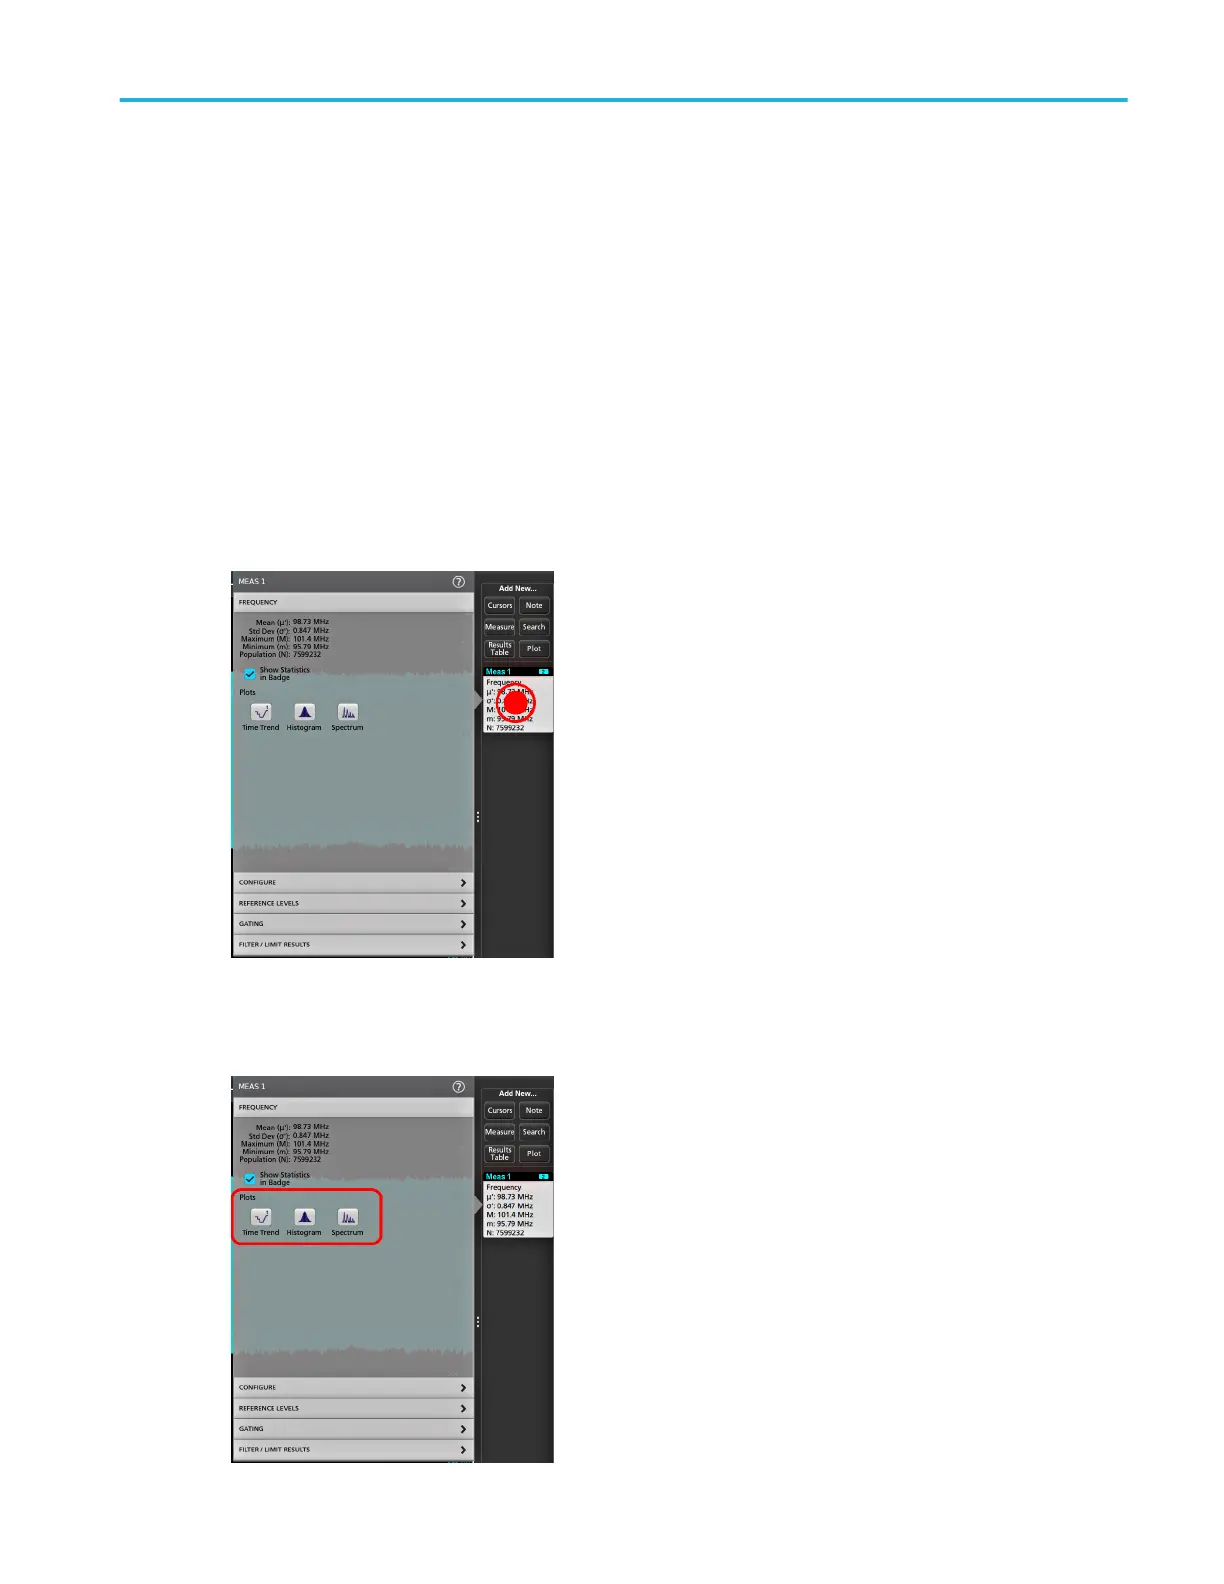
Add a plot of a measurement
Measurement plots let you graph the distribution of waveform datapoint occurrences (histogram), plot the frequency components
(spectrum) of a waveform, show the time trend of a measurement, display an eye diagram, and other supported plots depending
on the measurement. Available plots depend on the measurement.
1. Double-tap a Measurement badge to open the Meas configuration menu.
2. Tap a Plots button to add that plot for the measurement to the screen.
Operating basics
MSO54, MSO56, MSO58 Installation and Safety Manual 43
 Loading...