Getting Acquain
ted with the Oscilloscope
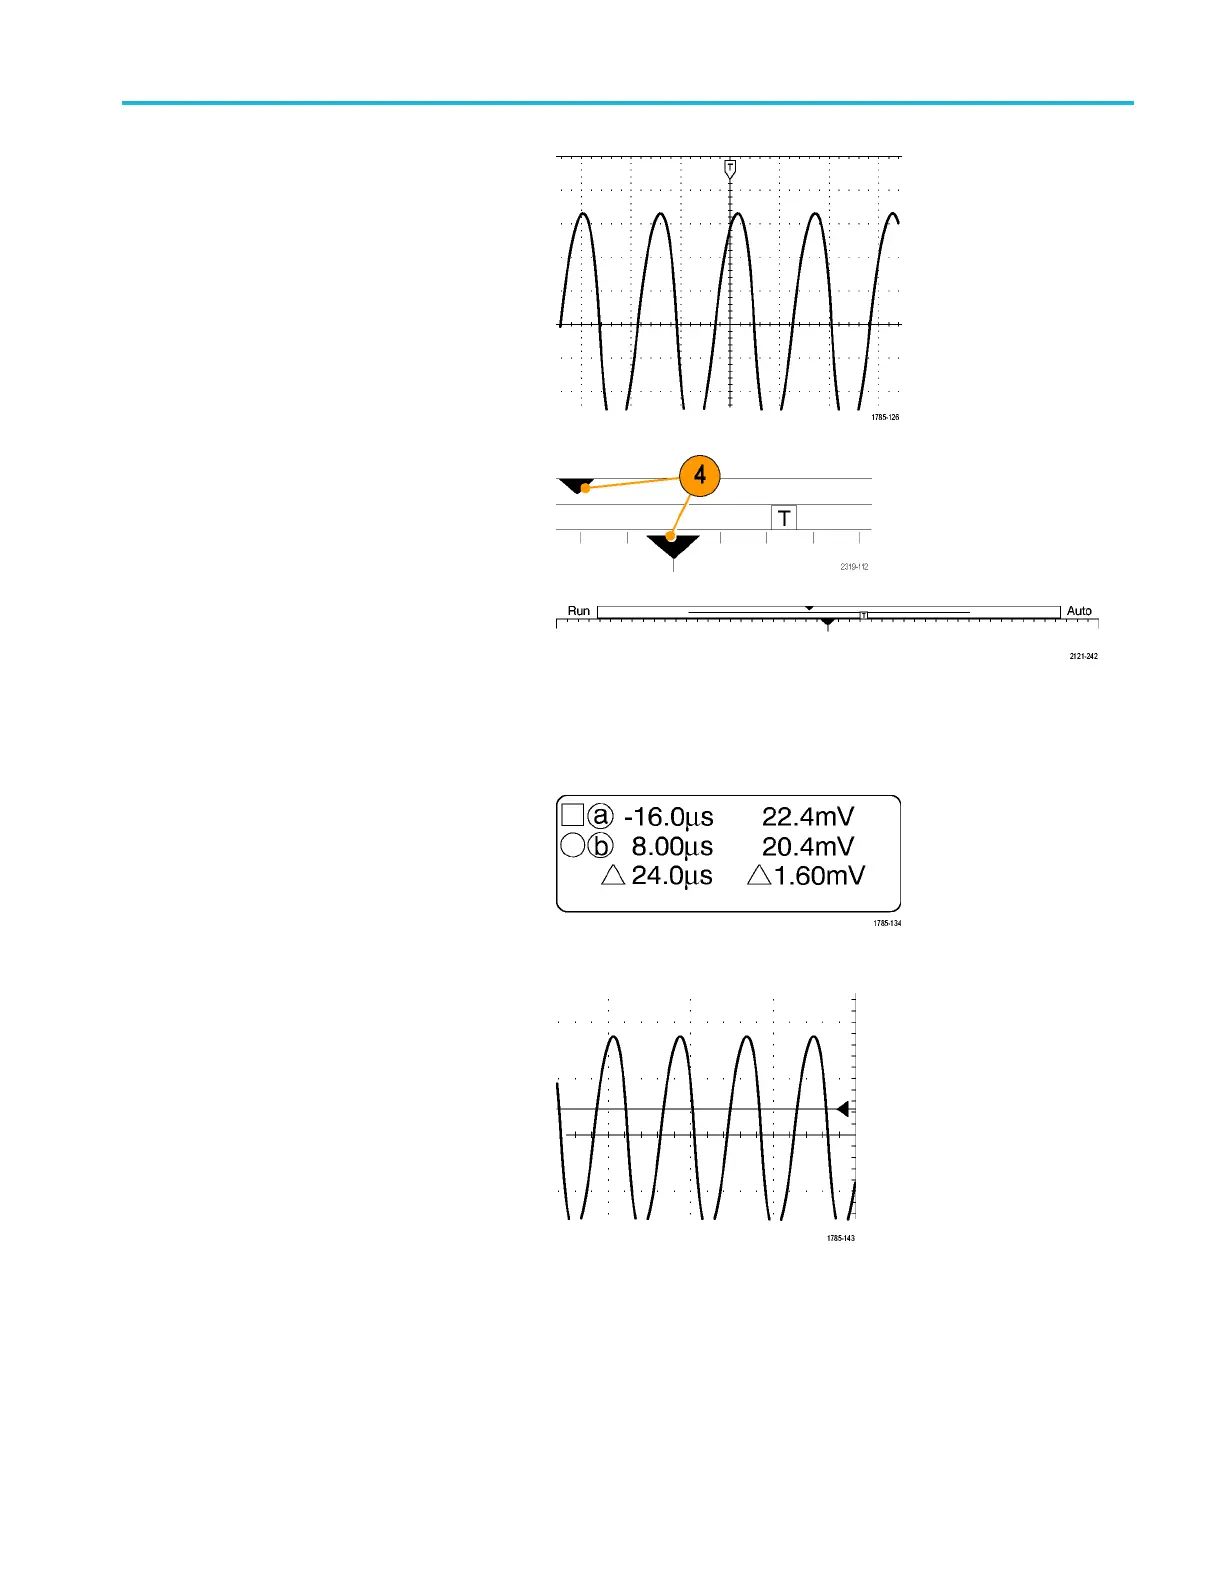
3. The trigger pos
ition icon shows where
the trigger occurred in the acquisition.
4. The expansion point icon (an orange
triangle)
shows the point that the
horizontal scale expands and
compresses around.
5. The waveform record view shows the
trigger l
ocation relative to the waveform
record. The line color corresponds to the
selected waveform color.
6. The FilterVu indicator shows if the
variabl
e low pass filter is active.
7. The cursor readout shows time,
amplit
ude, and delta () values for each
cursor.
For FFT measurements, it shows
freque
ncy and magnitude.
For serial buses, the readout shows the
decoded values.
8. The trigger level icon shows the trigger
level on the waveform. The icon color
corr
esponds to the trigger source color.
MSO2000B and DPO2000B Series Oscilloscopes User Manual 35