20
This tri-graph illustrates average system load over the course of ~3 minutes; each new measurement is taken every 3
seconds. The graph consists out of three colour coded graphs, each one corresponding to the average system load over
1 (red), 5 (orange) and 15 (yellow) most recent minutes. Although not graphed, the page also displays peak loads over 1,
5 and 15 minutes.
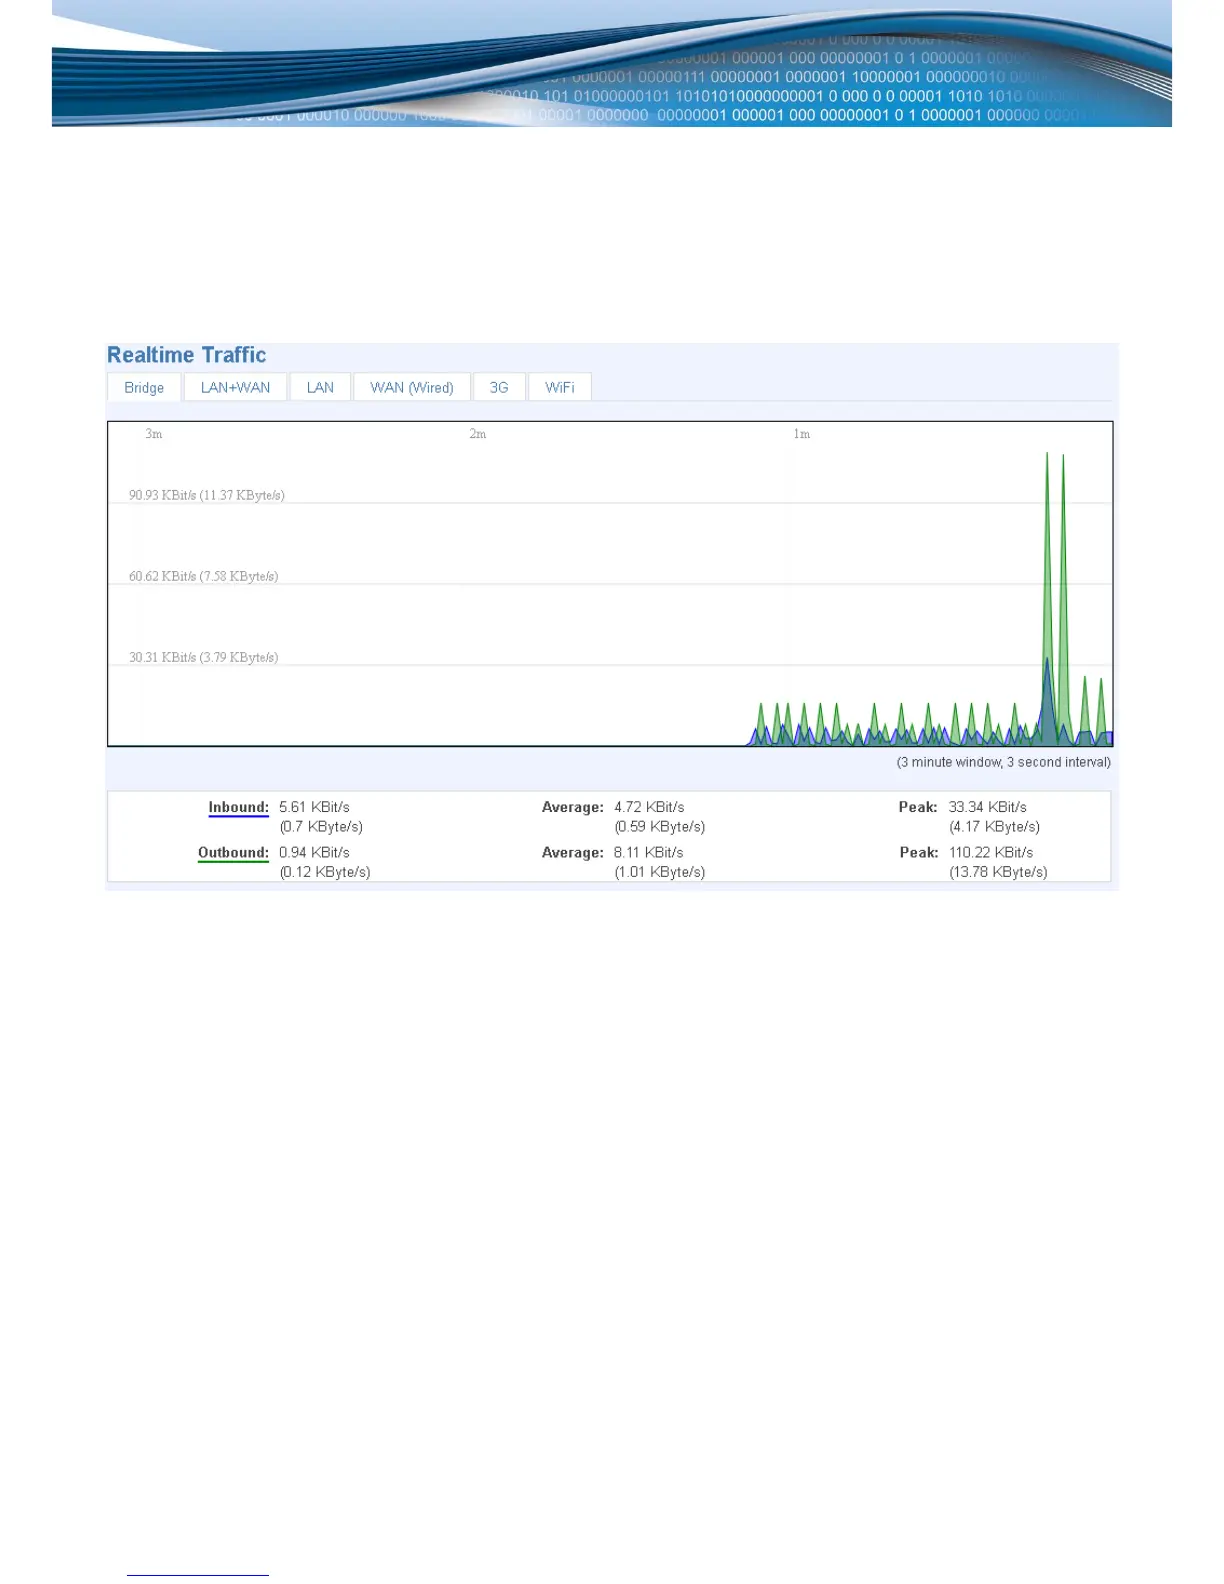
Traffic
Bridge
Cumulative graph, which encompasses wired Ethernet LAN and the wireless network.
 Loading...