42
Plotting data (continued)
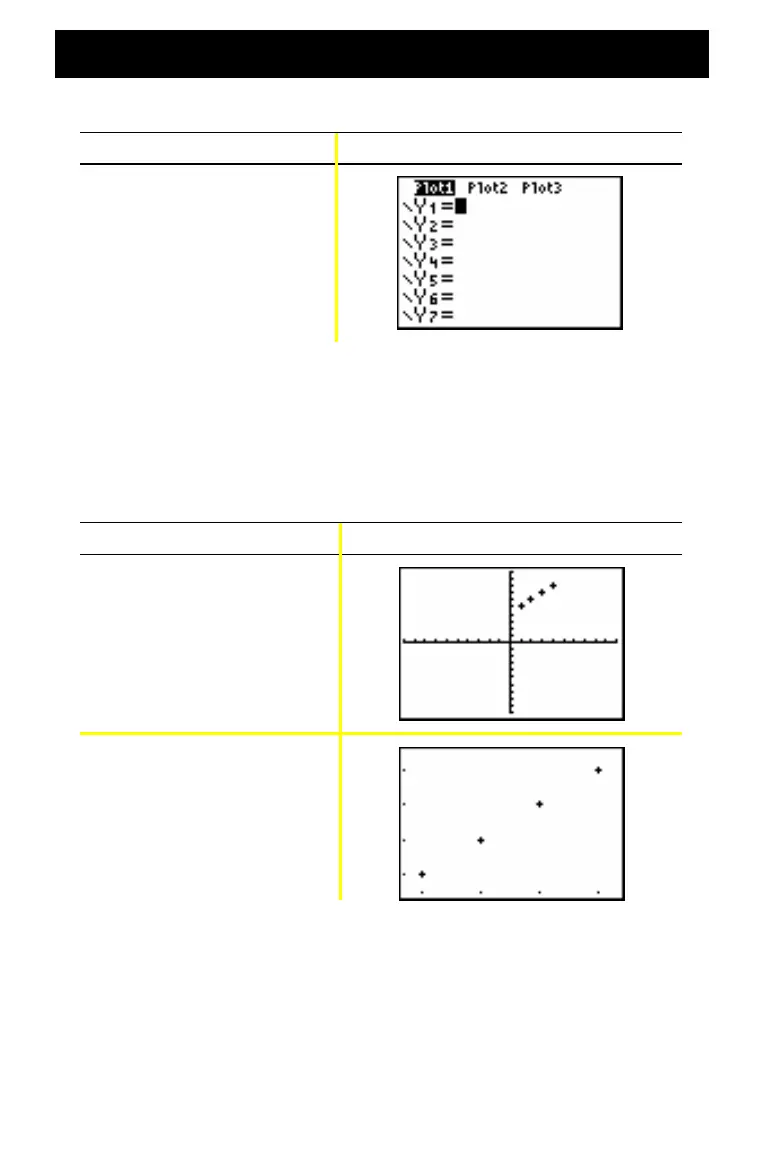
Press Result
o ‘
Note: This step is optional and is not necessary unless there is a previous
entry in the Y= Editor. If there are additional entries in the
Y= Editor, press
† ‘
until all are clear.
Display the plot
Press Result
s
q } } Í
(selects ZoomStat)
Note: If you would like to add the regression line to a scatter plot, follow
the instructions on page 43, adding Y1 to the end of the instruction:
LinReg(ax+b) L1, L2, Y1
. (Press
~ Í Í
to add
Y1.) Press
s
to see the regression line.

 Loading...


