Section 1: Scientific Method Name
Date
Fundamental Topics in Science © 2001 Texas Instruments
Try-It!™ 1-2
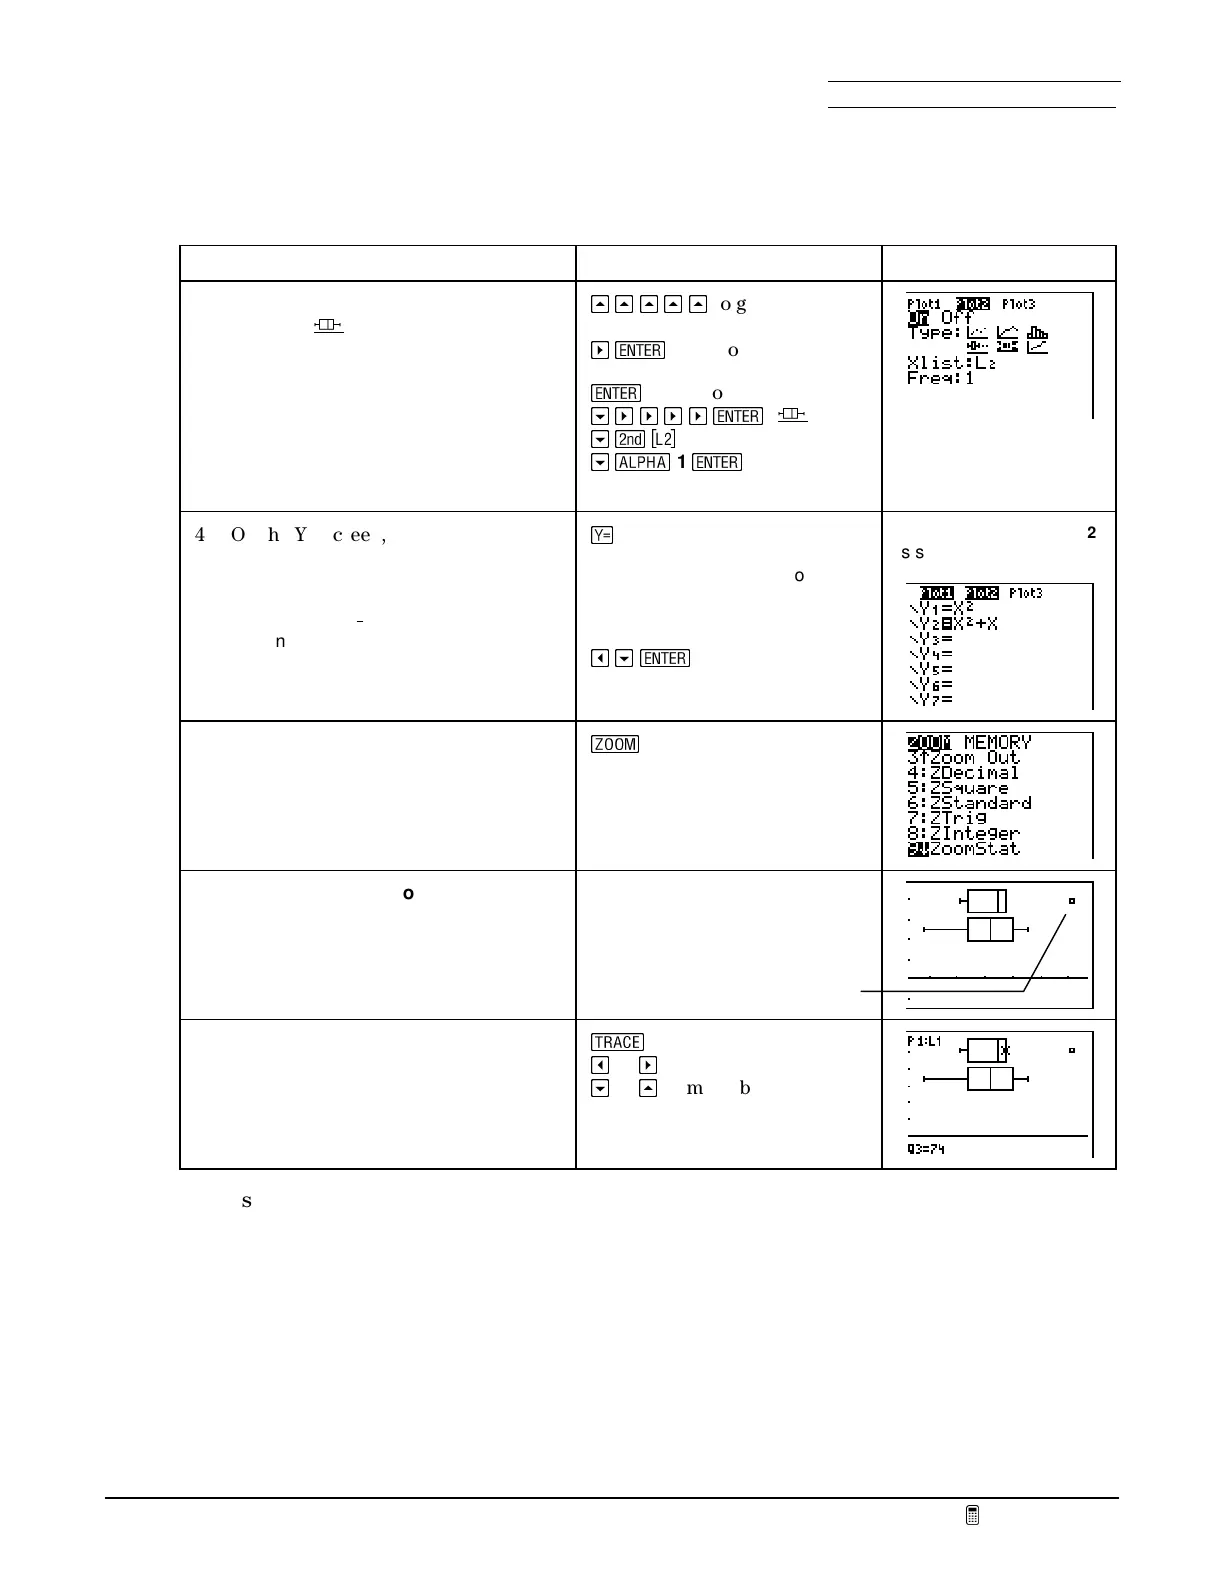
Define the statistical plots as box plots (cont.)
To Do This Press Display
3. Turn on
Plot2
and define it as a
Boxplot
(
¸
) of the female heart
rates.
Note: Boxplot
doesn’t graph anything as
a point, so
Mark
is not defined.
Note:
If
Plot3
was
On
in step 1, you will
need to turn it off, following the
procedure in step 2.
`
`
`
`
`
to go to the
list of plots
a
¯
to go to
Plot2
¯
to turn on
Plot2
h
a
a
a
a
¯
(
¸
)
h
\
H
h
e
1
¯
4. On the Y= screen, if any of the
equations are selected (highlighted),
turn them off.
Note:
On the TI
83 Plus, the graph
screen displays both graphs and stat
plots, which is why you should turn off
any graphing equations.
R
Note:
The keystrokes below
would turn off
Y
2
in the screen at
right.
_
h
¯
Note:
On this screen,
Y
2
is selected,
Y
1
is not.
5. Display the plots in an appropriate
viewing window.
Note:
The
ZoomStat
command
automatically calculates a good viewing
window.
T
9:ZoomStat
When you select
ZoomStat
, the plots
are displayed immediately.
6. Explore the median and range of the
plots using the trace feature.
U
_
or
a
to move on a plot
h
or
`
to move between plots
What is the median value for the boys? For the girls? Write a description of the heart-rate
samples based on the box plots.
#
outlier

 Loading...


