Section 1: Scientific Method Name
Date
Fundamental Topics in Science © 2001 Texas Instruments
Try-It!™ 1-5
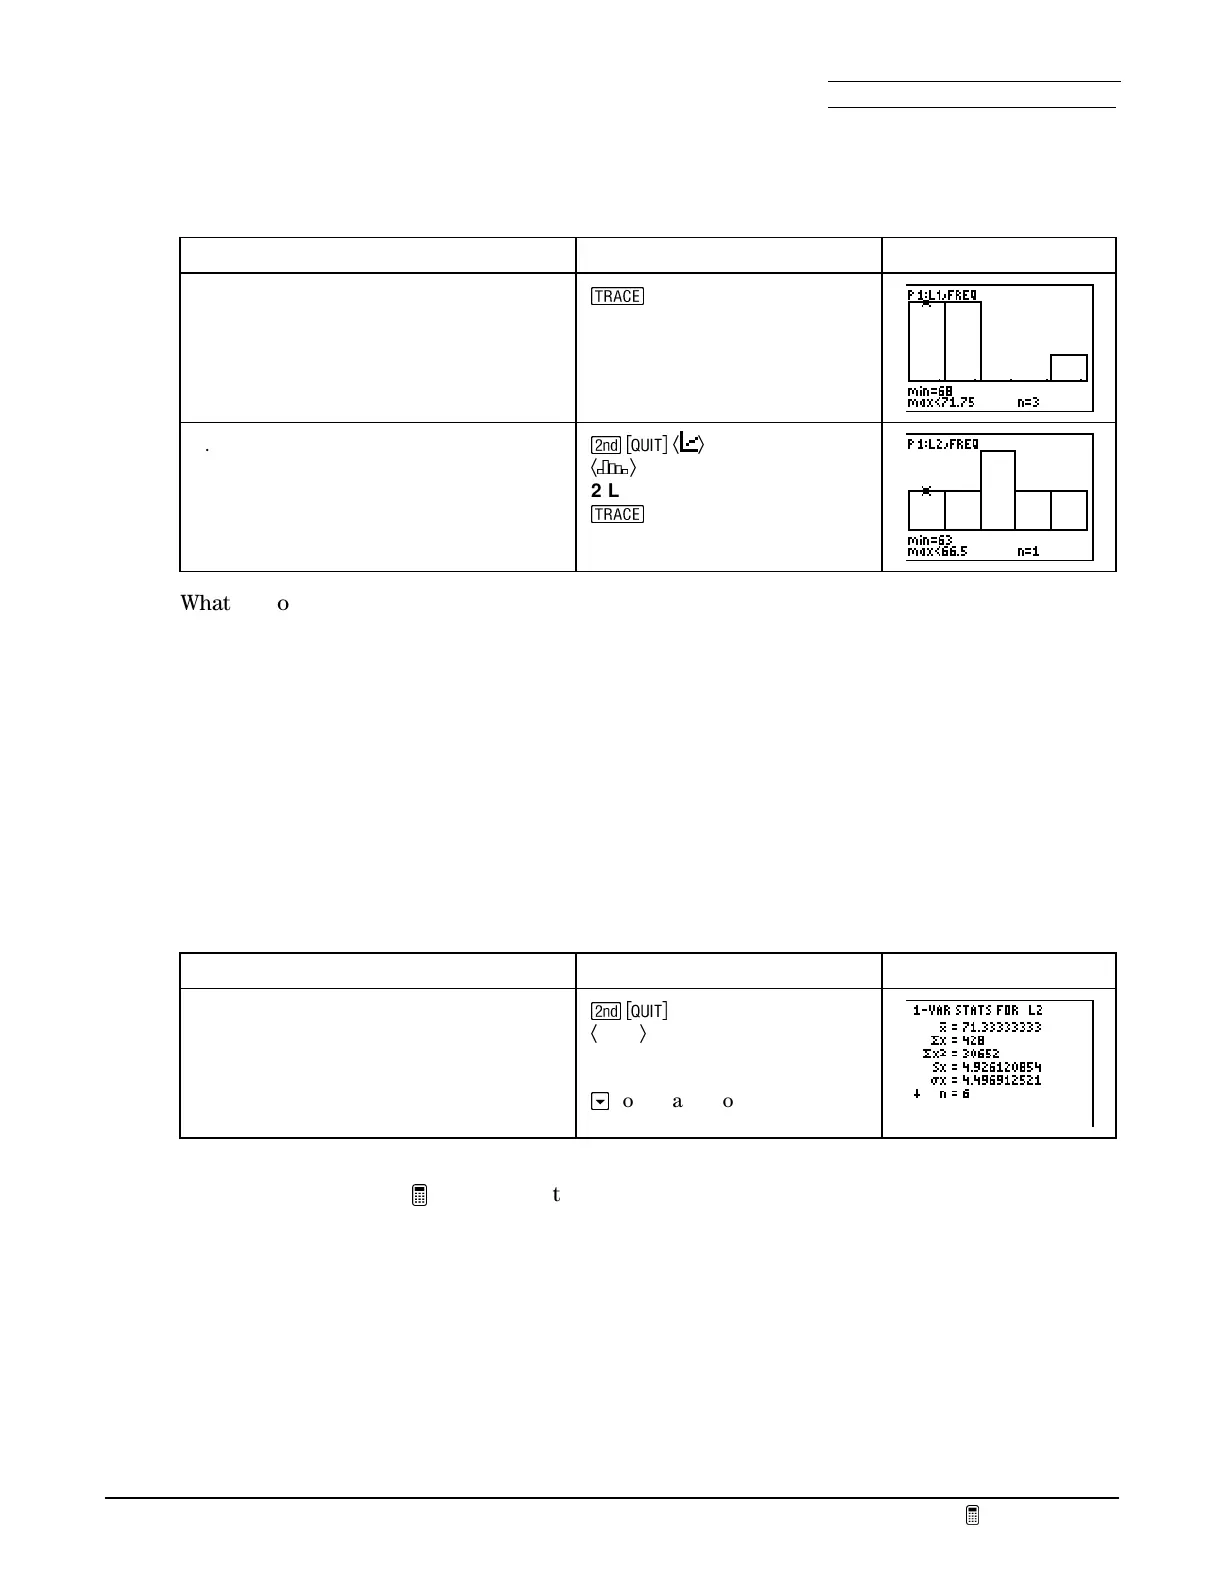
Define the statistical plots as histograms with the Data/Graphs Wizard (cont.)
To Do This Press Display
4. Trace the values to analyze the data.
U
5. Plot and trace a histogram for the
girls.
\
Ã
Ä
Ã
´
Ä
2:L
2
U
What do you learn about heart-rate samples based on the histogram for the boys? For the girls?
#
Calculate the statistical variables with the Data/Graphs Wizard
Calculate the statistics for the girls.
To Do This Press Display
1. Display the
DATA/GRAPHS WIZARD
screen and select
ANALYZE DATA
.
Select the girls’ list.
\
Ã
STAT
Ä
2:L
2
h
to see additional values
What is the median value for the girls (
L
2
)? How would you compare the statistics for the boys
(obtained earlier in this
Try-It! activity) to those of the girls?
#
 Loading...


