Section 2: Precision & Accuracy
Fundamental Topics in Science © 2001 Texas Instruments Teacher Notes 2-10
Try-It!™ on Your TI
83 Plus (cont.)
Students then use the list editor and statistical calculation features of the calculator.
Some indicators of accuracy include:
Average =
mean(L
1
)
= 123.81 g
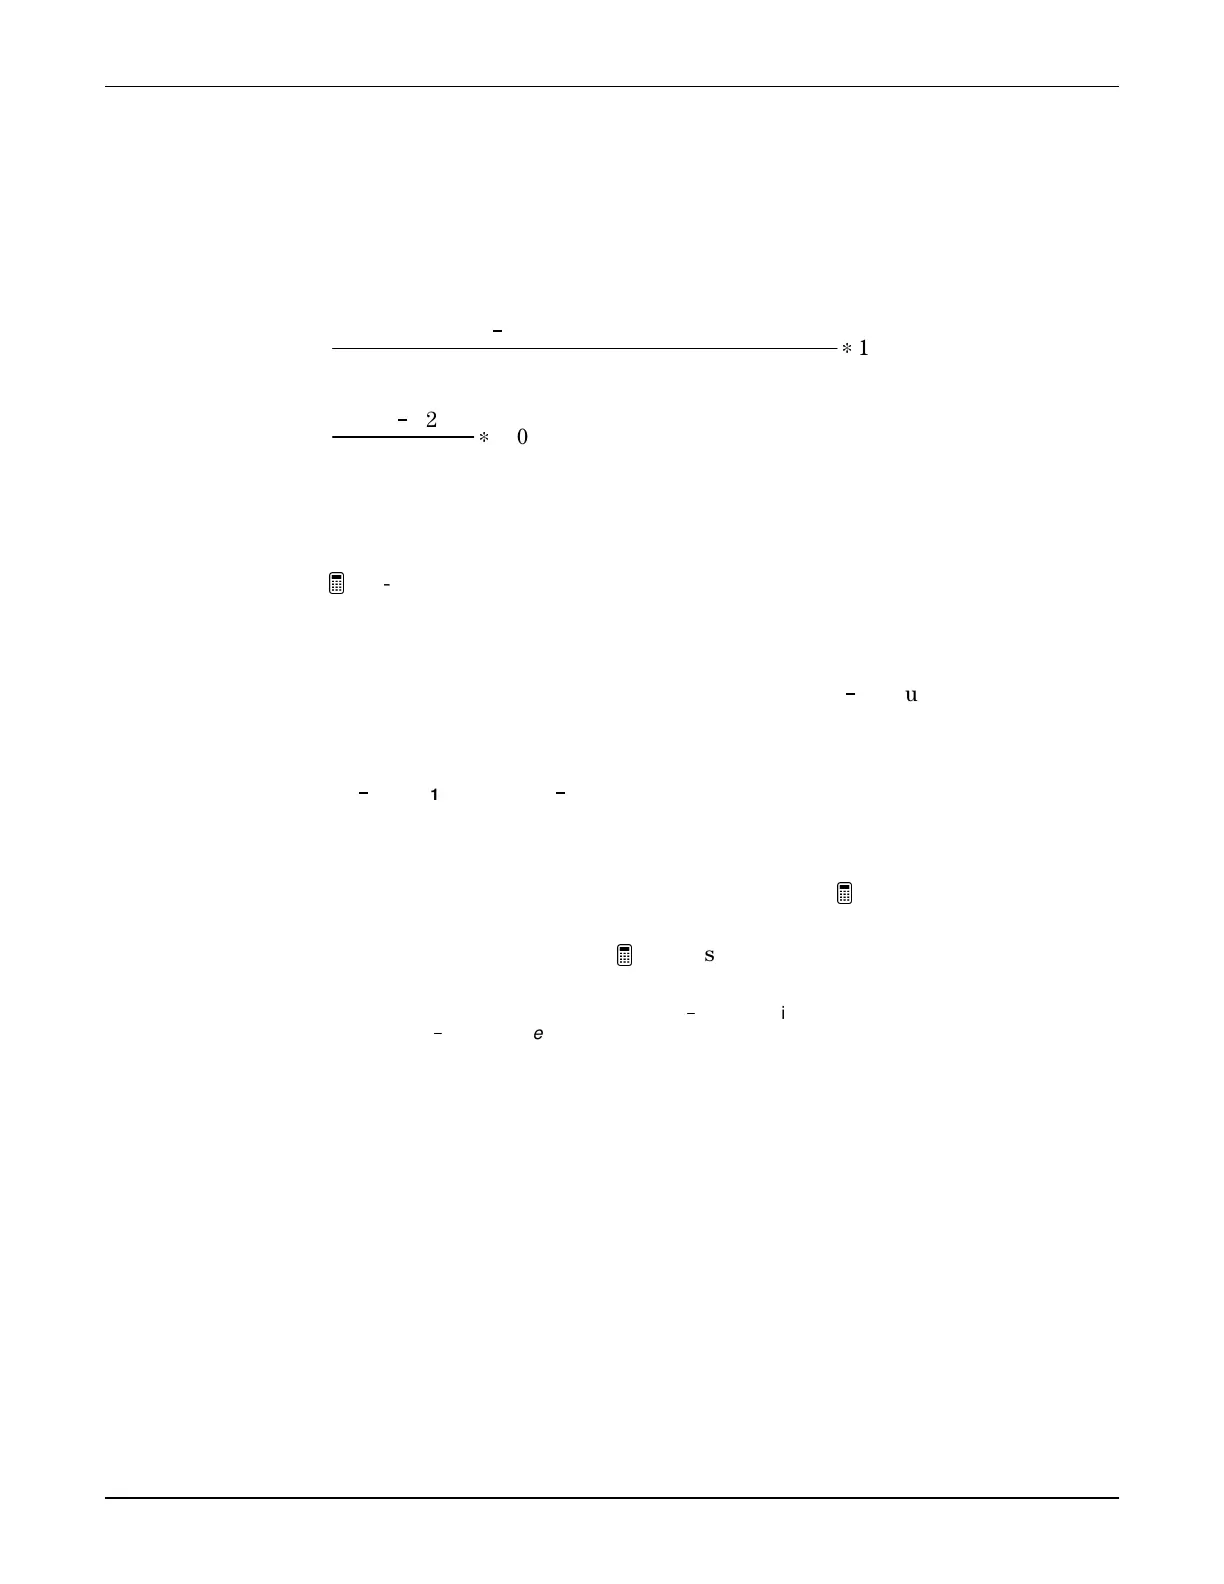
percent error =
(accepted value
1
experimentally determined value)
(accepted value)
g
100
percent error =
(125.0
1
123.8)
(125.0)
g
100 = 0.96%
Students are asked if this is a large error or a small error. You may need to remind students that
this isn’t a 96% error, which is a large error; instead it is close to a 1% error, which is a small
error.
This portion of
Try-It! activity requires the use of the Science Tools application. This free
application came with the Fundamental Topics in Science application and is accessible from the
SCIENCE CHAPTERS
menu, but it must be loaded separately.
Standard deviation is an excellent indicator of the precision of measurements. Range is another
way of evaluating how precise a measurement is. Students use the TI
1
83 Plus to make these
calculations.
Standard deviation =
stdDev(L
1
)
= 3.517 g
Range = [
max(L
1
)
1
min(L
1
)
] = 130.0 g
1
118.6g = 11.4 g
Students are asked to describe in writing how accurate and how precise the measurements are.
You may recommend that students routinely use the
1-VAR STATS
function rather than
performing individual calculations or calculator operations. See the
Try-It! activity in
SCIENTIFIC METHOD
for an example.
Space is provided for written answers on the
Try-It! sheets, but if the students are keeping
journals, you may wish to direct them to record their responses in their journals instead.
Note:
The calculator features are described more fully in the
TI
1
83 Plus
guidebook. The
SCIENCE TOOLS
application
is described more fully in the
TI
1
83 Plus Science Tools
user guide.

 Loading...


