Section 5: Data & Graphs Name
Date
Fundamental Topics in Science © 2001 Texas Instruments
Try-It!™ 5-6
Fit a logistic curve to the data and analyze visually
Repeat the steps above for the logistic regression. (This regression takes a while to plot; be
patient.) Neither
r
2
nor
R
2
is calculated for the logistic regression, so you will have to rely on
visual analysis.
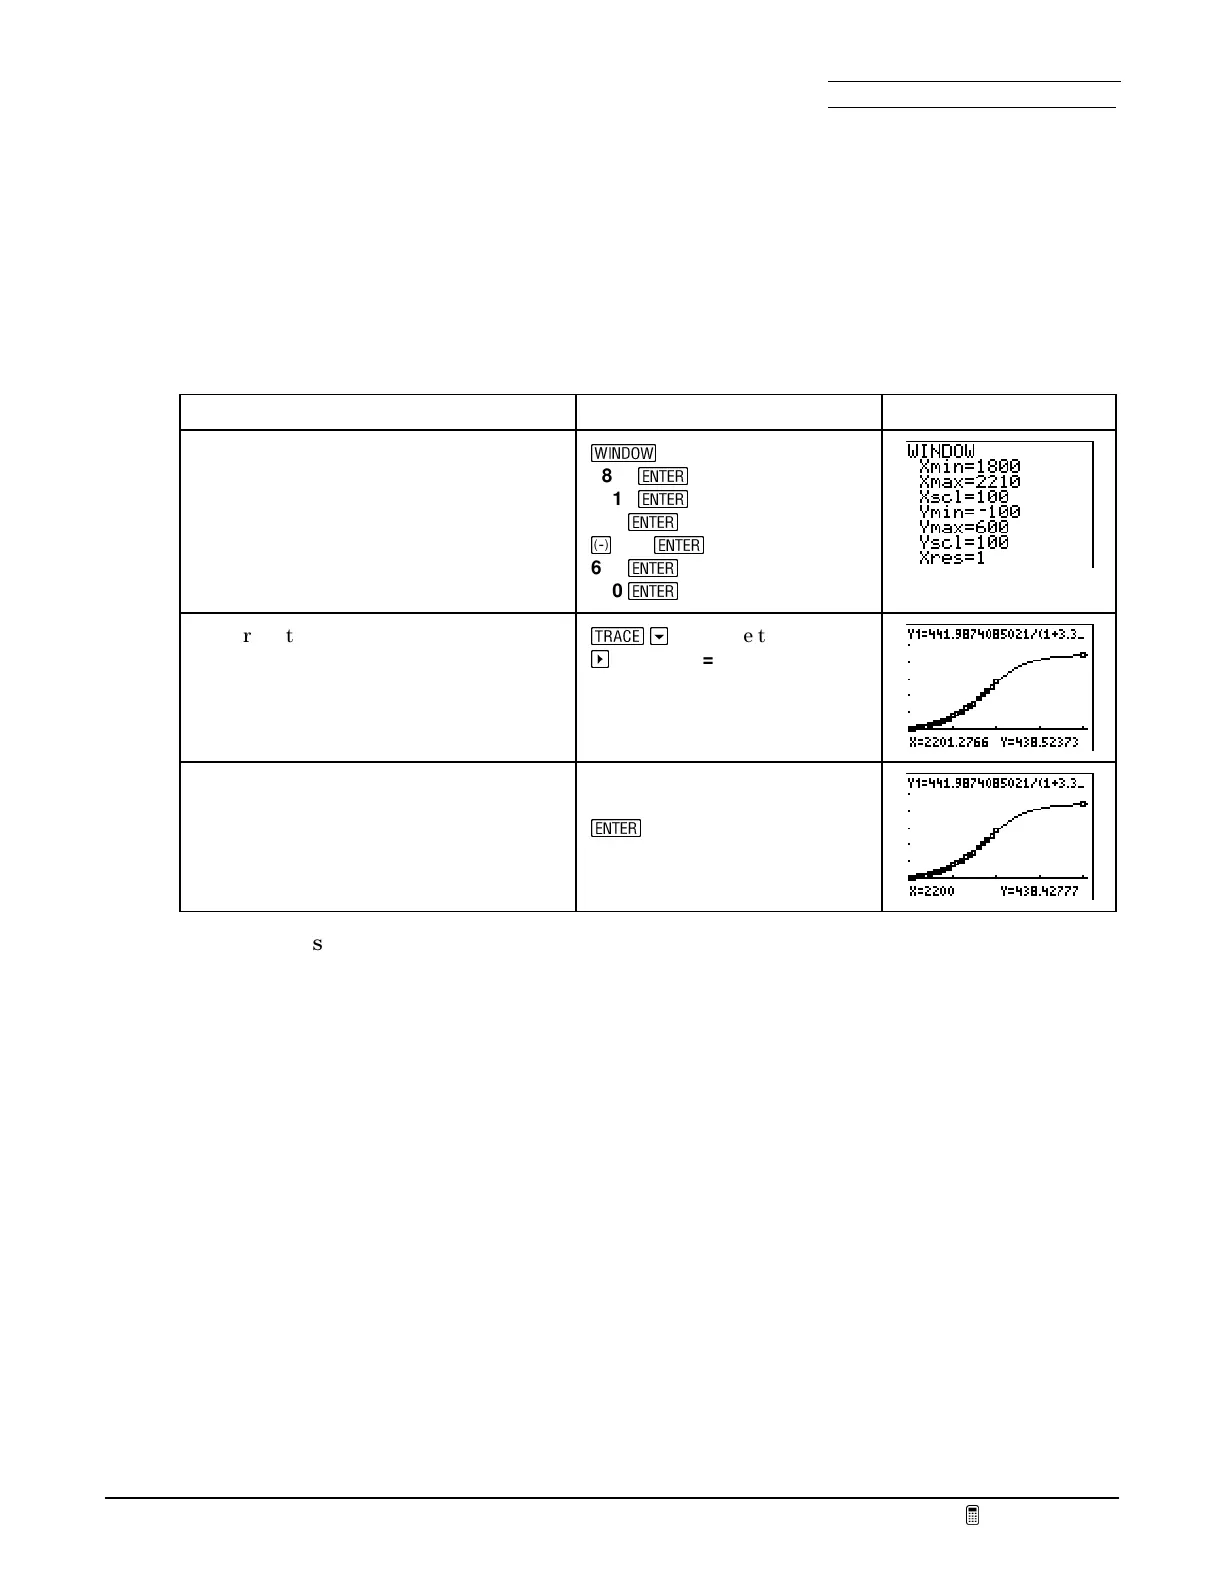
You can change the viewing window and trace the function to determine the predicted value in
200 years (the year 2200).
To Do This Press Display
1. When the regression and plot are
displayed, change the X range to 2210
to include the year 2210 and the Y
range to accommodate a larger
population.
S
1800
¯
2210
¯
100
¯
®
100
¯
600
¯
100
¯
2. Trace to a value near the year 2200.
U
h
(to move to
Y1
)
a
(to near
X=2200
)
3. You can display the value of
Y
at
exactly 2200.
2200
¯
How well does the data fit visually? What is the approximate population in the year 2200?
(Remember to give your answer to three significant figures.) List several real-world factors that
would suggest that a logistic model is more likely to be accurate than an exponential model.
#
The US Census Bureau uses a complex model to project population. Their model estimates the
population in 2050 will be 404 million, and in 2100 will be 571 million. How does this compare
with the logistic model’s predictions for those years? What does this suggest about the results
for 2200?
#

 Loading...


