Section 5: Data & Graphs
Fundamental Topics in Science © 2001 Texas Instruments Teacher Notes 5-8
Introduction
This section introduces the idea that data is everywhere, and that we need to organize data in
order to make sense of it. Tables and graphs are powerful tools for representing data in an
organized, visual, and concise manner.
Concepts
If your students are keeping journals, you may want them to write their responses in their
journals. If they are not keeping journals, have them write their responses on a blank sheet of
paper.
This section explores how tables and graphs are very effective ways to view certain types of
data. Measurements taken over time are one such type of data. The growth of a tree is animated
over a period of several years. On a
WRITE IT DOWN
screen, students are first asked to write a
sentence describing the tree’s growth.
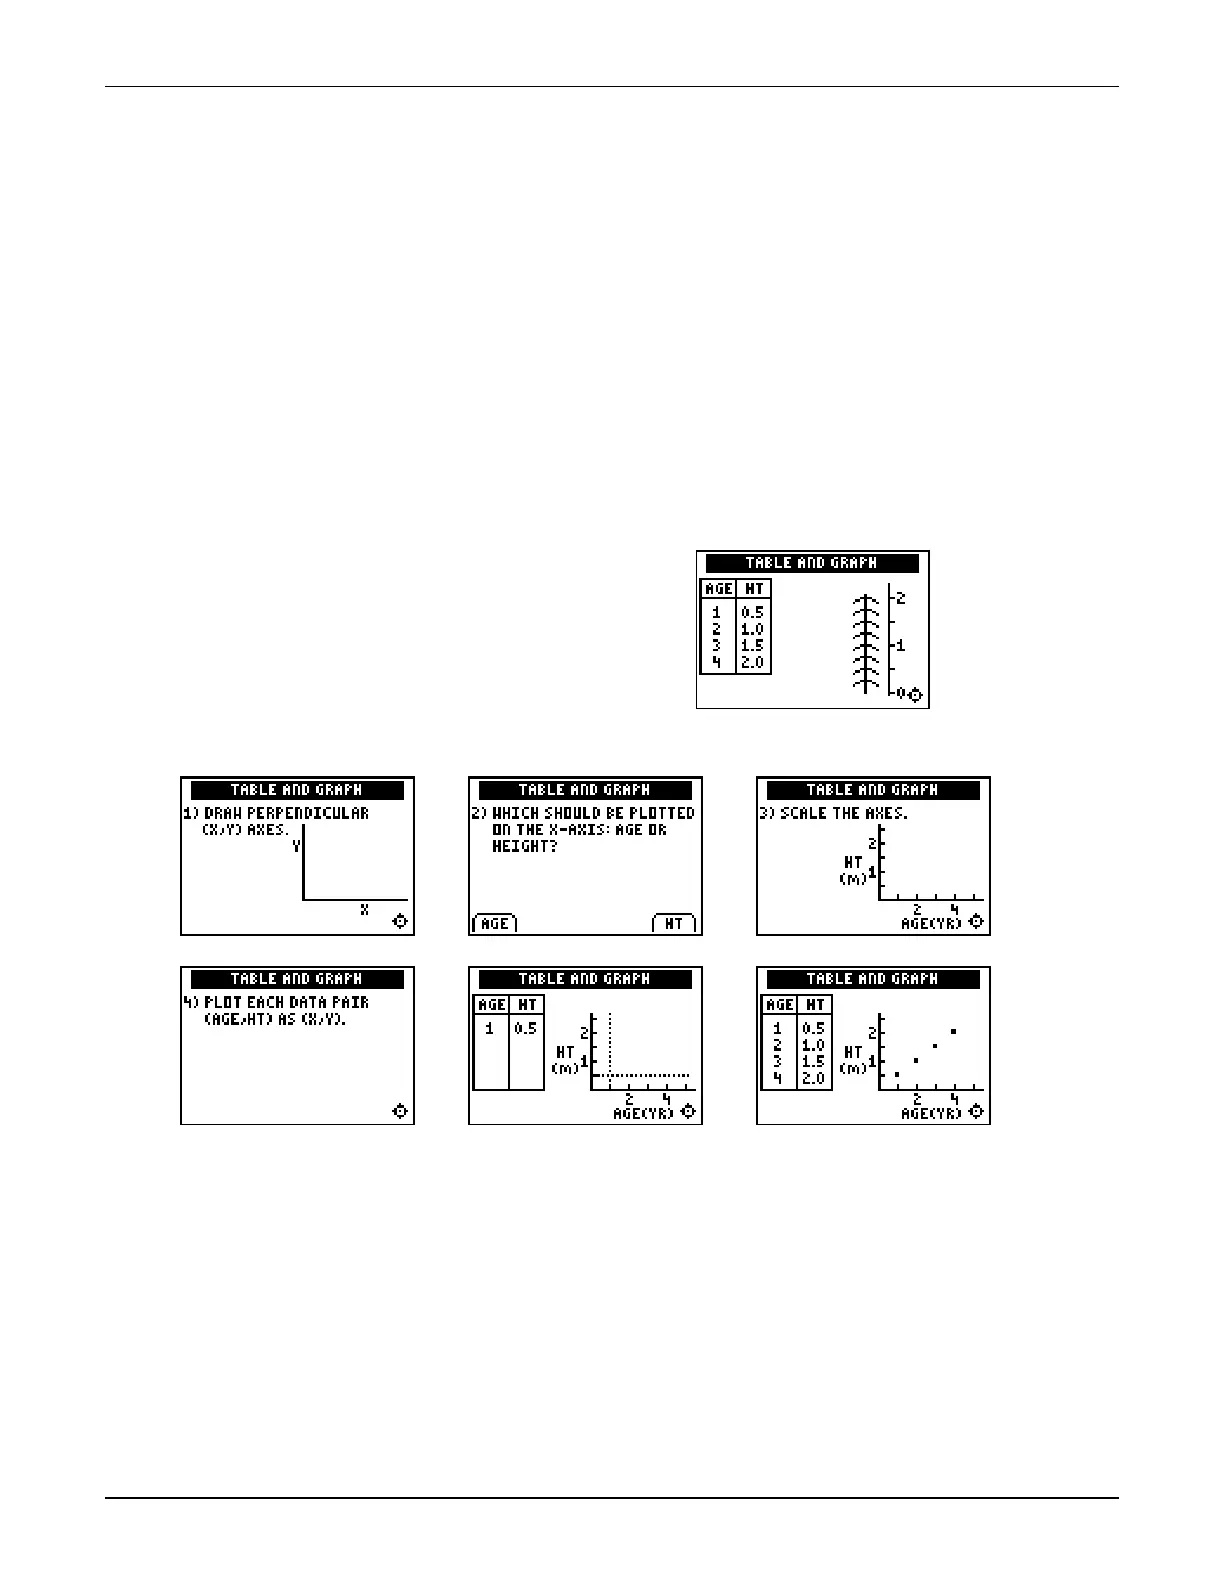
Next, a table and plot of the data representing
the tree’s growth is developed.
The creation of a graph is developed step by step.
In a second
WRITE IT DOWN
screen, students are asked to discuss ways in which a table and plot
are more useful than a descriptive sentence.
Extension
Ask students to think of other types of data that they would like to view in table and graph form.
Then ask them to think of some types of data where that wouldn’t be quite so helpful. If they
aren’t sure, point out that in this graph, the height and the age are both meaningful, correlated
numbers (variables). Based on one number (variable), they can make predictions about the
unknown half of a pair. If they measured the height of four classmates (a single variable), would
a table and graph help them in predicting the height of a fifth classmate, or would that be better
predicted by a calculation of statistical measures such as the mean or median of the four data
points?

 Loading...


