Section 5: Data & Graphs
Fundamental Topics in Science © 2001 Texas Instruments Teacher Notes 5-9
Concepts
(cont.)
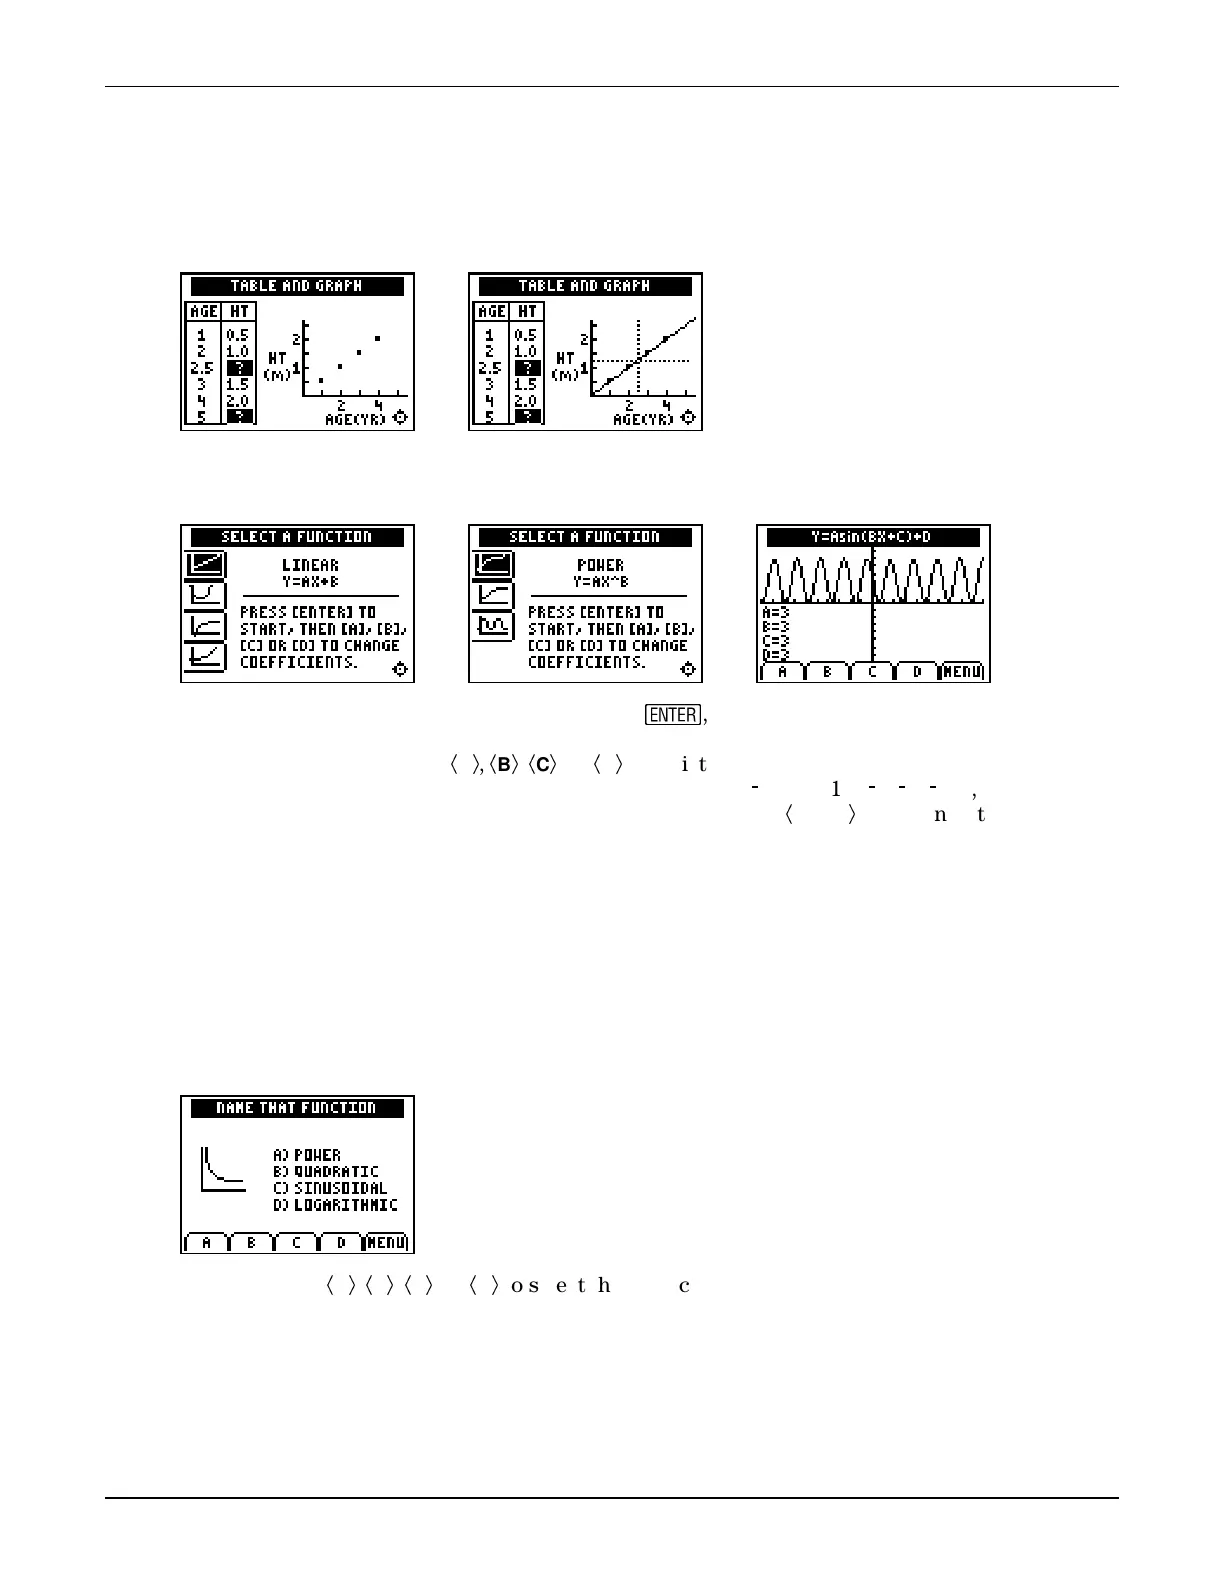
The concept of using a table and/or graph to predict values between and beyond observation
points by visualizing a line connecting the points is presented.
Students explore the effect of varying each of the coefficients in the equations that define seven
common function types (linear, quadratic, logarithmic, exponential, power, logistic, sinusoidal).
When the student selects a function by pressing
¯
, the function is displayed on the graph
screen, with all parameters equal to 3. The student can reduce the value of the parameter by 1
each time he or she presses
Ã
A
Ä
,
Ã
B
Ä
,
Ã
C
Ä
, or
Ã
D
Ä
associated with the matching parameter. The
parameter values cycle through the limited range from 3 to
/
1 (3, 2, 1, 0
/
1,
/
2,
/
3, 3, 2, . . .). When
finished exploring a particular function, the student can select
Ã
MENU
Ä
to return to the menu and
select a new function.
Extension
Suggest that students experiment to determine which parameters to change (and to what values)
to make the function as flat as possible and as close to the X axis as possible.
Activity—Name that Function
This activity provides students with practice in identifying common functions by their typical
plot “shapes.” Seven problems are presented (the order varies each time).
Students press
Ã
A
Ä
,
Ã
B
Ä
,
Ã
C
Ä
, or
Ã
D
Ä
to select the correct answer. They earn 20 points for the
correct answer on the first try, 10 points on the second try, up to a maximum 140 points. Tell
students if you wish them to record their scores and if they can repeat the activity to improve
their scores.

 Loading...


