TIp 7: Creating a Statistical Plot
Fundamental Topics in Science © 2001 Texas Instruments
TIp 7-3
Try-It!
Ë
on Your TI
83 Plus
(continued)
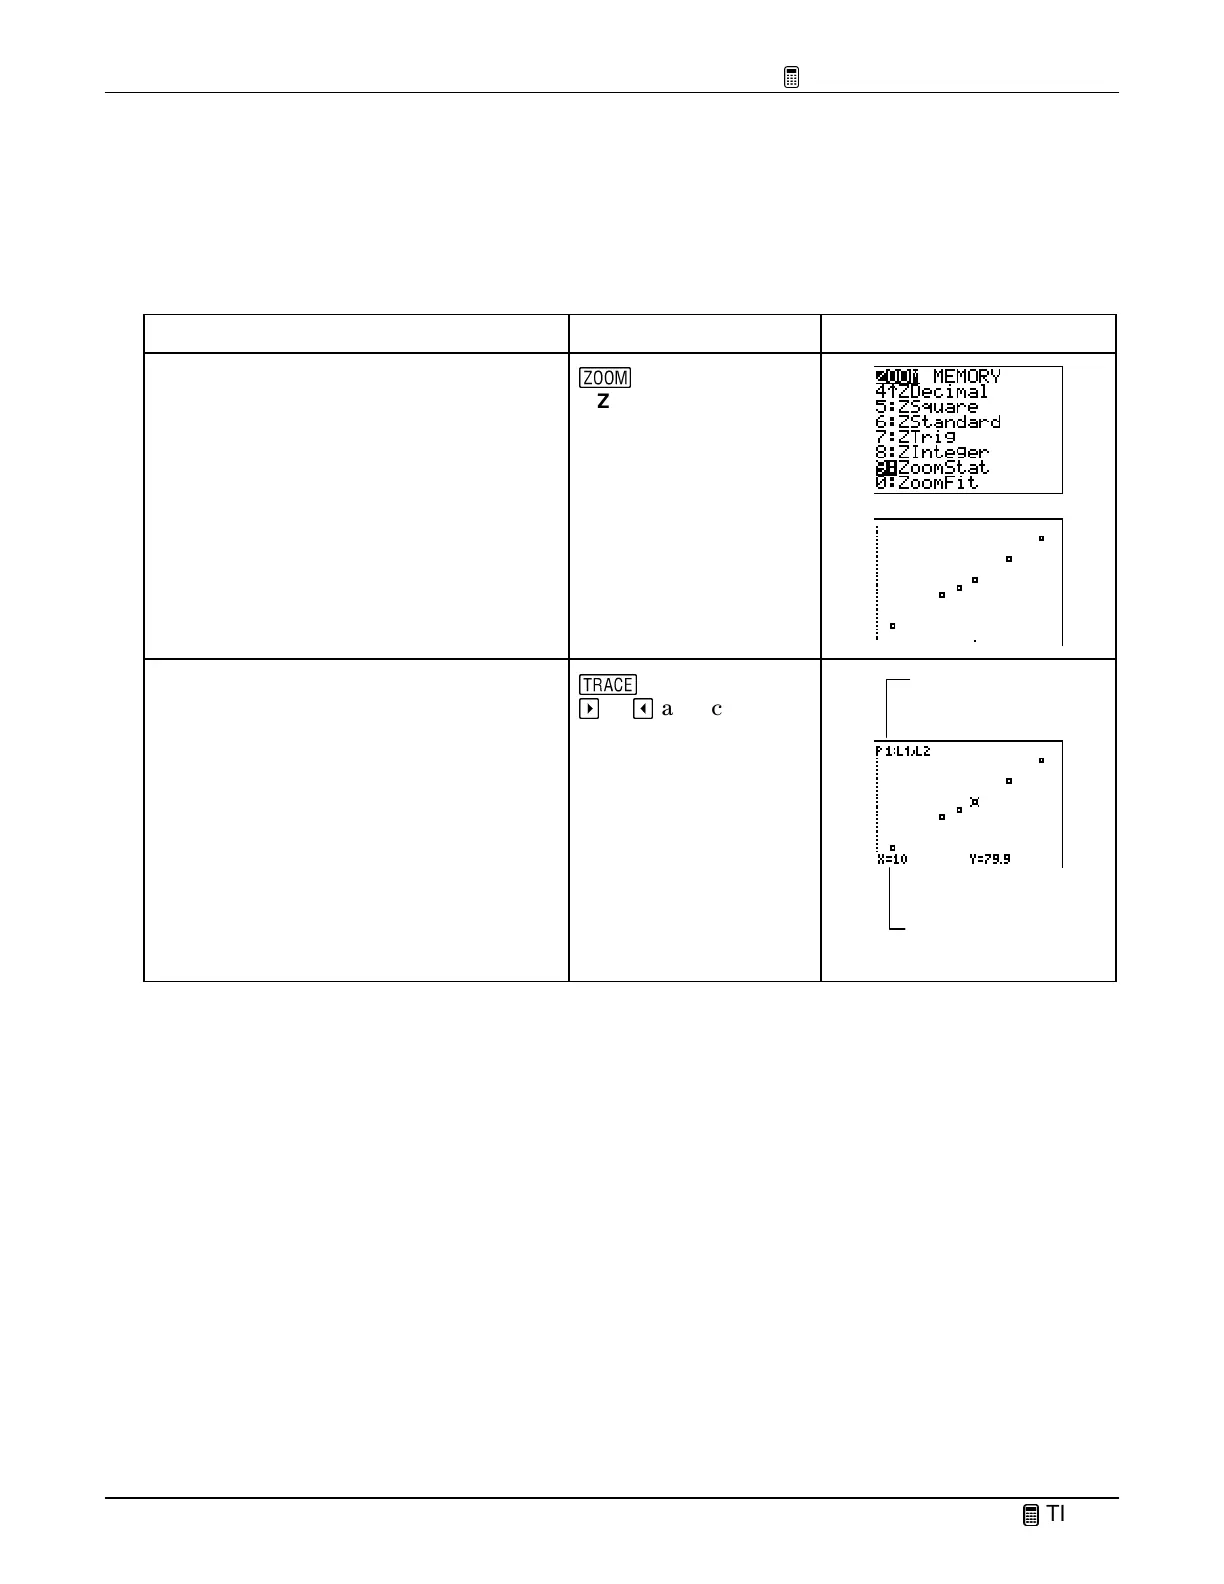
Display the Statistical Plot on the Graph Screen
Display the statistical plot on the graph screen using the
ZoomStat
command and trace it.
To Do This Press Display
1. Select
ZoomStat
from the
ZOOM
menu.
(
9:ZoomStat
2. Trace along the statistical plot.
Note:
P1:L
1
,L
2
in the upper left corner shows that
the lists
L
1
and
L
2
contain the data for the graph.
The data points are displayed at the bottom of the
screen.
)
"
or
!
as necessary
L
1
and
L
2
contain the
data for this graph.
(
X,Y
) coordinates of
the data point at the
cursor location.

 Loading...


