TIp 8: Finding the Best Line of Fit for a Set of Data
Fundamental Topics in Science © 2001 Texas Instruments
TIp 8-4
Try-It!
Ë
on Your TI
83 Plus
(continued)
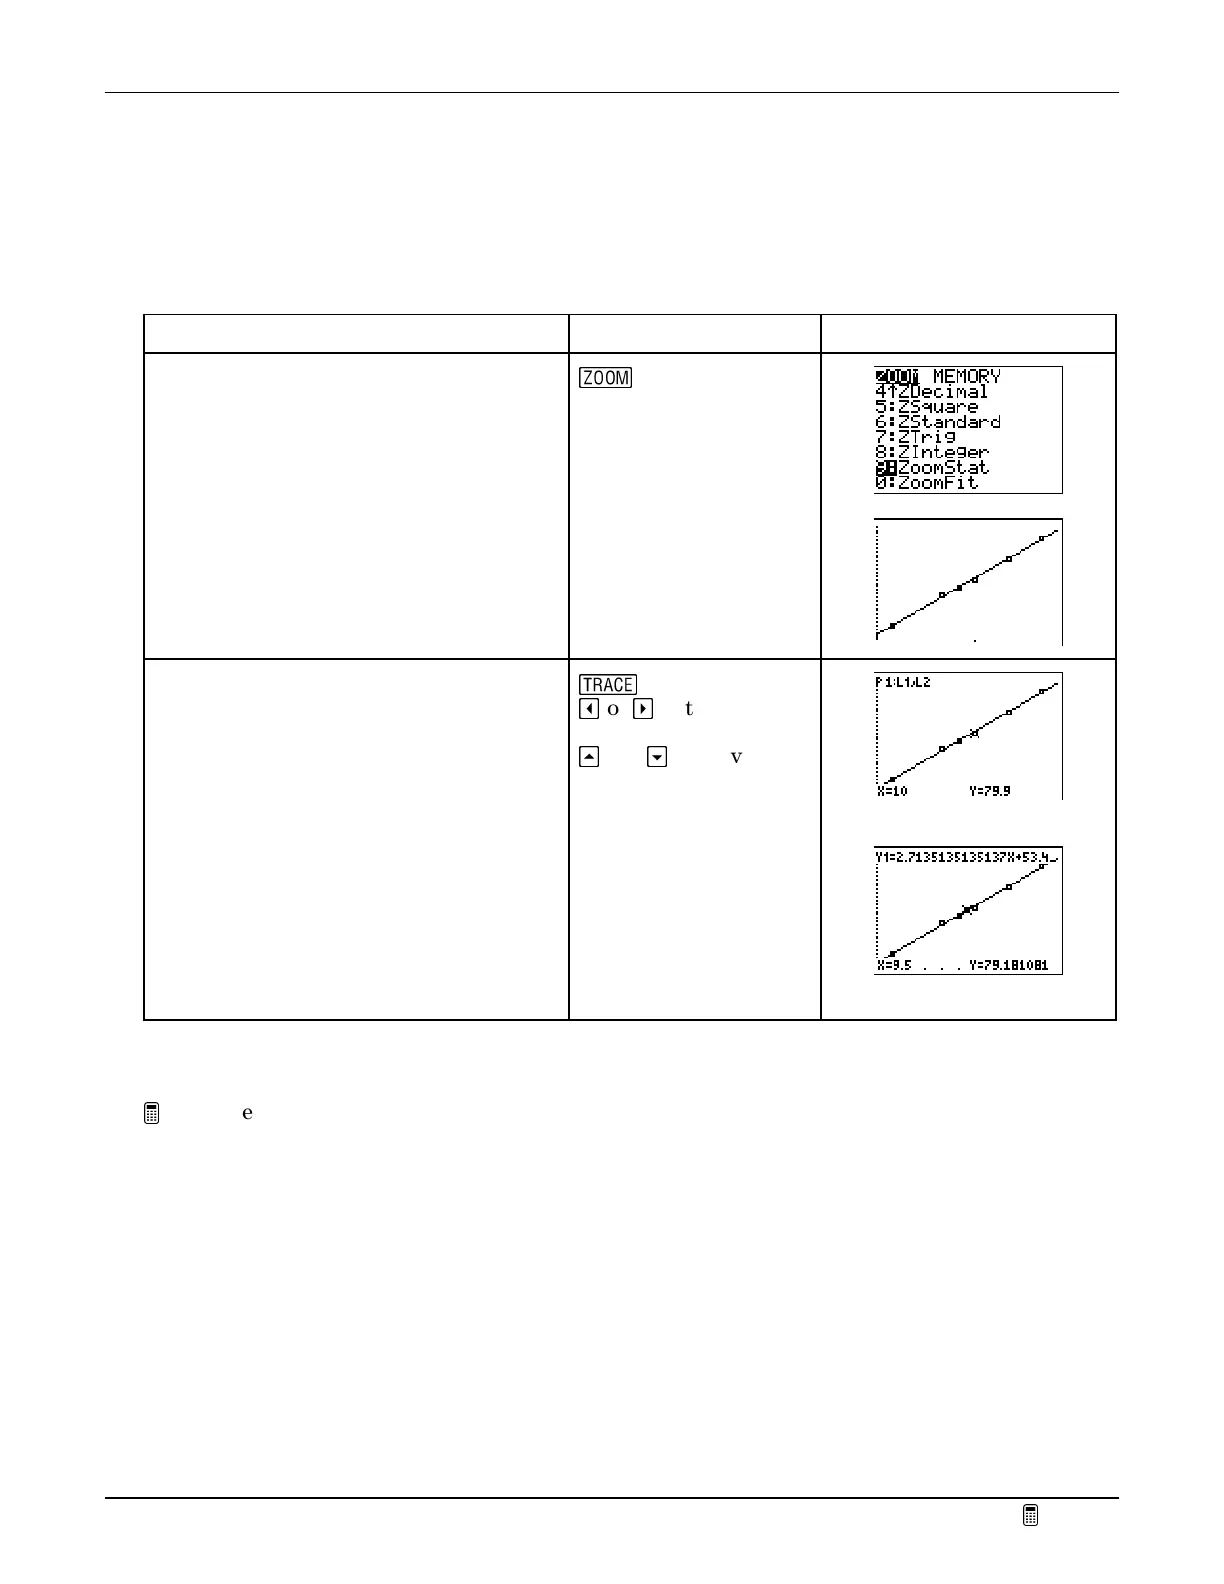
Graph the Statistical Plot and the Linear Regression
Graph and trace the statistical plot and linear regression at the same time and compare them.
To Do This Press Display
1. Select the
ZoomStat
function to
display the statistical plot and the
regression on the graph screen at the
same time.
T
9:ZoomStat
2. Trace the function or the statistical
plot.
Notes
: The function or plot being traced is
displayed in the upper left corner of the screen.
The
X
and
Y
coordinates display at the bottom of
the screen.
U
_
or
a
to trace a
function
`
and
h
to move
between functions
Tracing along the stat plot
Tracing along the line
On Your Own
Use the function to predict approximately how far you think the boy can throw the ball
above his head at 18 years old. Do you think the line will give a good idea of how high this
person will be able to throw the ball when he is 35? Explain your thoughts.
Hint:
Use the table to determine the value of
Y
1
when
X=18
.
 Loading...


