As you graph multiple plots, the defining relation is displayed for each. You can
define and graph a maximum of 99 relations of each type.
5. Use the b key to explore and analyze the relation to:
• Trace the relation.
• Find points of interest.
• Assign a variable in the expression to a slider.
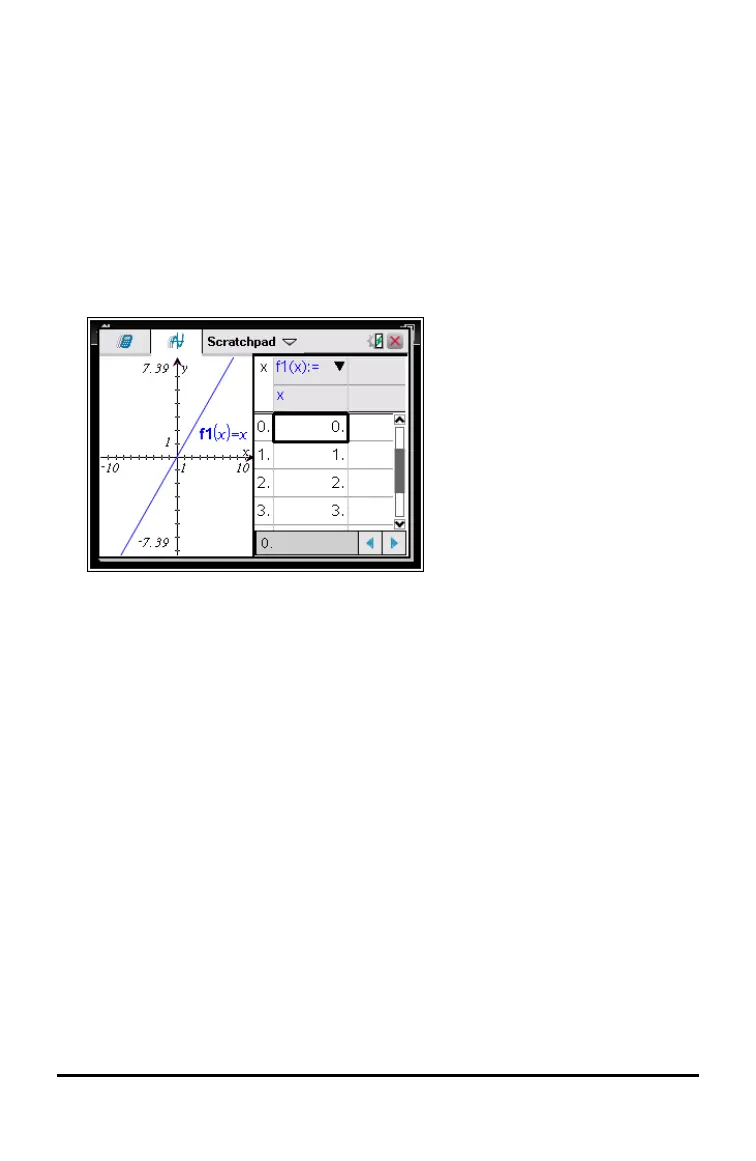
Viewing the Table
▶ To display a table of values corresponding to the current plots, press b > Table
> Split-screen Table (b 7 1).
▶ To hide the table, click the graph side of the split screen, and then press b >
Table > Remove Table (b 7 2). You can also press Ctrl + T.
▶ To resize columns, click the table and press b > Actions > Resize (b 1 1).
▶ To delete a column, edit an expression, or edit table settings, click the table and
press b > Table (b2).
Changing the Appearance of the Axes
As you work with graphs, the Cartesian axes are displayed by default. You can change
the appearance of the axes in the following ways:
1. Press b 4 and choose the Zoom tool to use.
2. Select the axes and press / b 2 to activate the Attributes tool.
a) Press £or¤ to move to the attribute to change. For example, choose the end
style attribute.
b) Press ¡or¢ to choose the style to apply.
Using the Scratchpad 29
 Loading...