Optical Spectrum Analyzers Chapter 4: Description
Rev D, June 16, 2022 Page 10
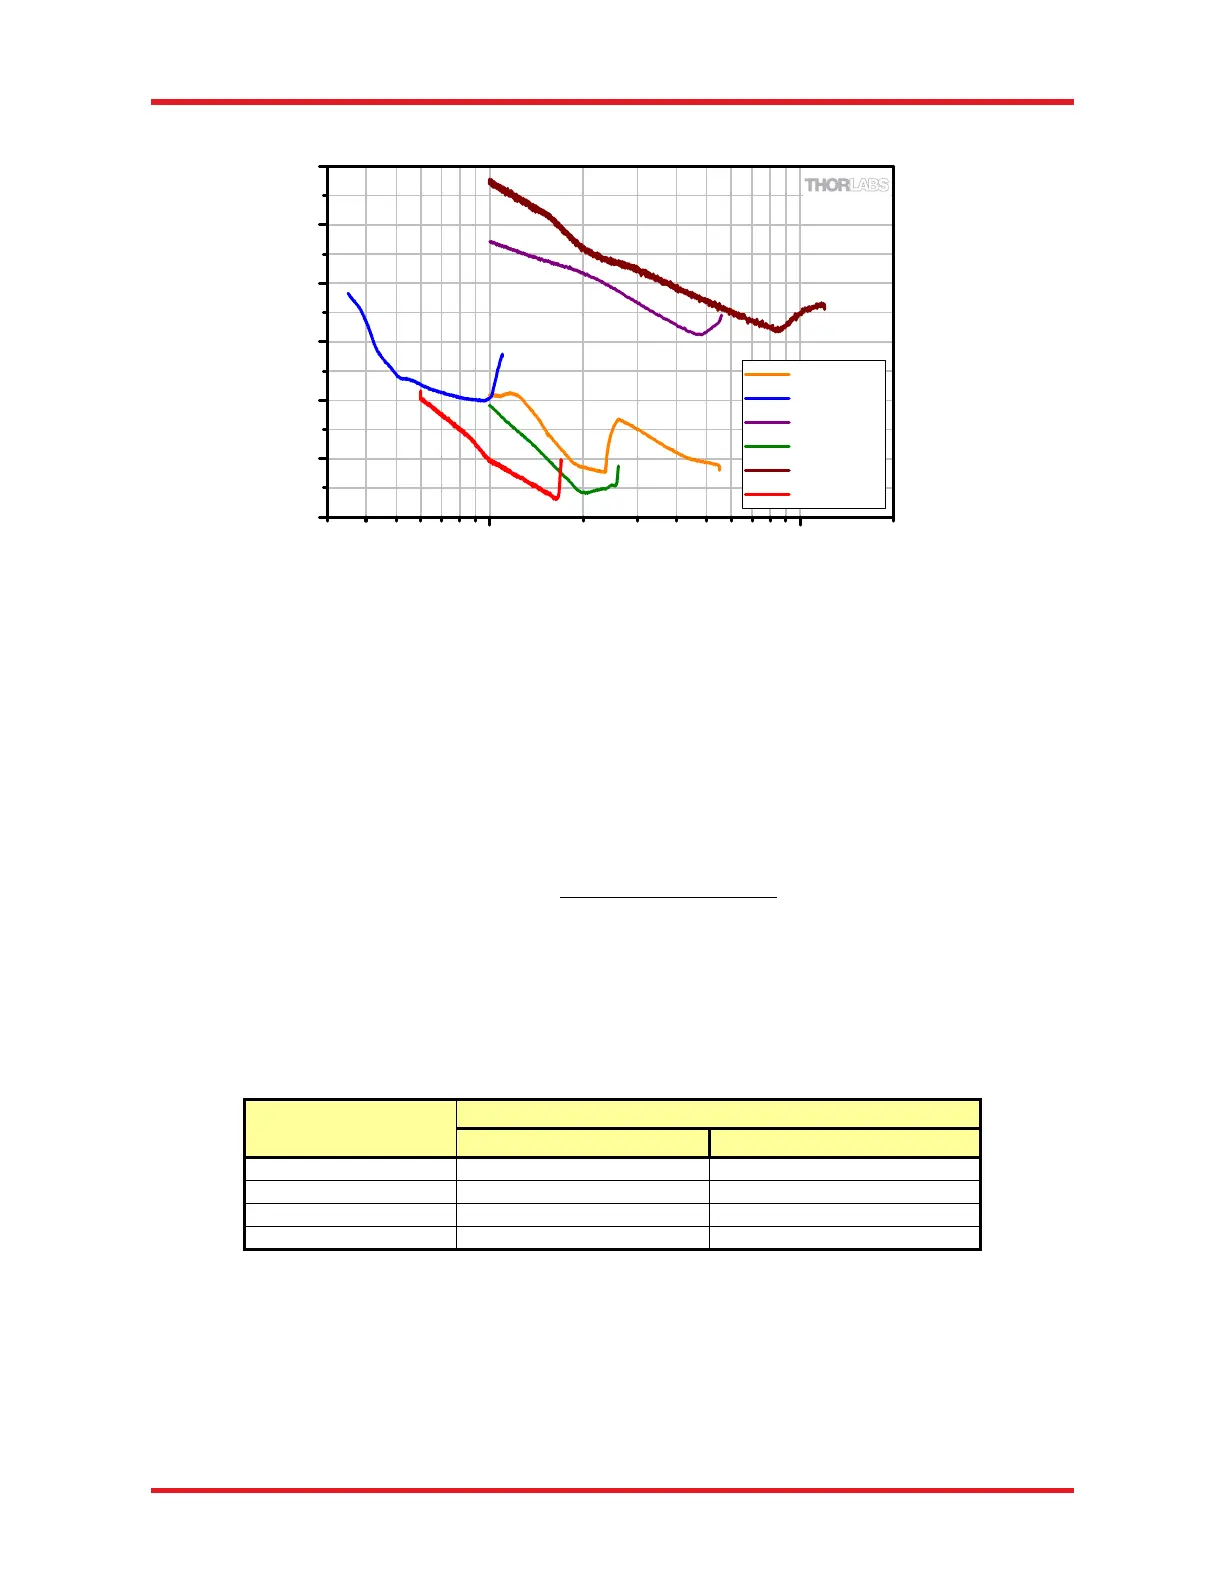
Figure 5. Noise Floor in Power Density Mode, i.e., the mode for measuring broadband light sources
4.9. Dynamic Range/Optical Rejection Ratio
The ability to measure low-level signals close to a peak is determined by the optical rejection ratio (ORR) of the
instrument. It can be seen as the filter response of the OSA, and can be defined as the ratio of the power at an
interesting peak to the power at a given distance from said peak. For the Thorlabs OSAs the ORR is defined
with a stricter condition: instead of just considering the power at a single data point, e.g., 25 GHz from the peak,
the power of the highest noise in the wavelength range from 25 GHz to 2 THz is related to the power of the
peak. This way, any additional limiting peaks that are not located at the test distances will still be included in the
ORR value:
𝑂𝑅𝑅
𝜈
𝑃
𝜈
max
𝑃
𝜈∈
𝜈
,2 THz
If the ORR is not higher than the optical signal-to-noise ratio of the source to be tested, the measurement will
indicate the limit of the OSA rather than the tested source. Figure 6 and the table below provide some example
values for the optical rejection ratio of the OSA205C and Redstone OSA305 for a narrowband source at
1532 nm with the following settings: High Resolution, Low Sensitivity, average of 5 traces, Hann apodization,
and Zero Fill = 0. All OSA20xC models and the Redstone OSA305 show similar behavior if the distance from
the peak is measured in frequency, e.g., GHz.
Distance from
1532 nm Peak
Optical Rejection Ratio
OSA205C Redstone OSA305
0.2 nm
25 GHz
30 dB 40 dB
0.8 nm
100 GHz
37 dB 42 dB
6.2 nm
800 GHz
44 dB 45 dB
7.8 nm
1000 GHz
44 dB 45 dB
110
-90
-80
-70
-60
-50
-40
-30
OSA305
OSA201C
OSA205C
OSA203C
OSA207C
OSA202C
200.3
OSA Noise Floor in Power Density Mode
Noise Floor (dBm/nm)
Wavelength (µm)

 Loading...


