Optical Spectrum Analyzers Chapter 7: Software
Rev D, June 16, 2022 Page 22
7.1.4. Setting the Unit of the Vertical Axis
In Interferogram view, the vertical axis displays the interferogram as a percentage of the full measurable range
(default) or in “counts” on the ADC. To switch between the two units, open the Settings dialog, select the Display
page, and check or uncheck the box “Interferogram in Percent.”
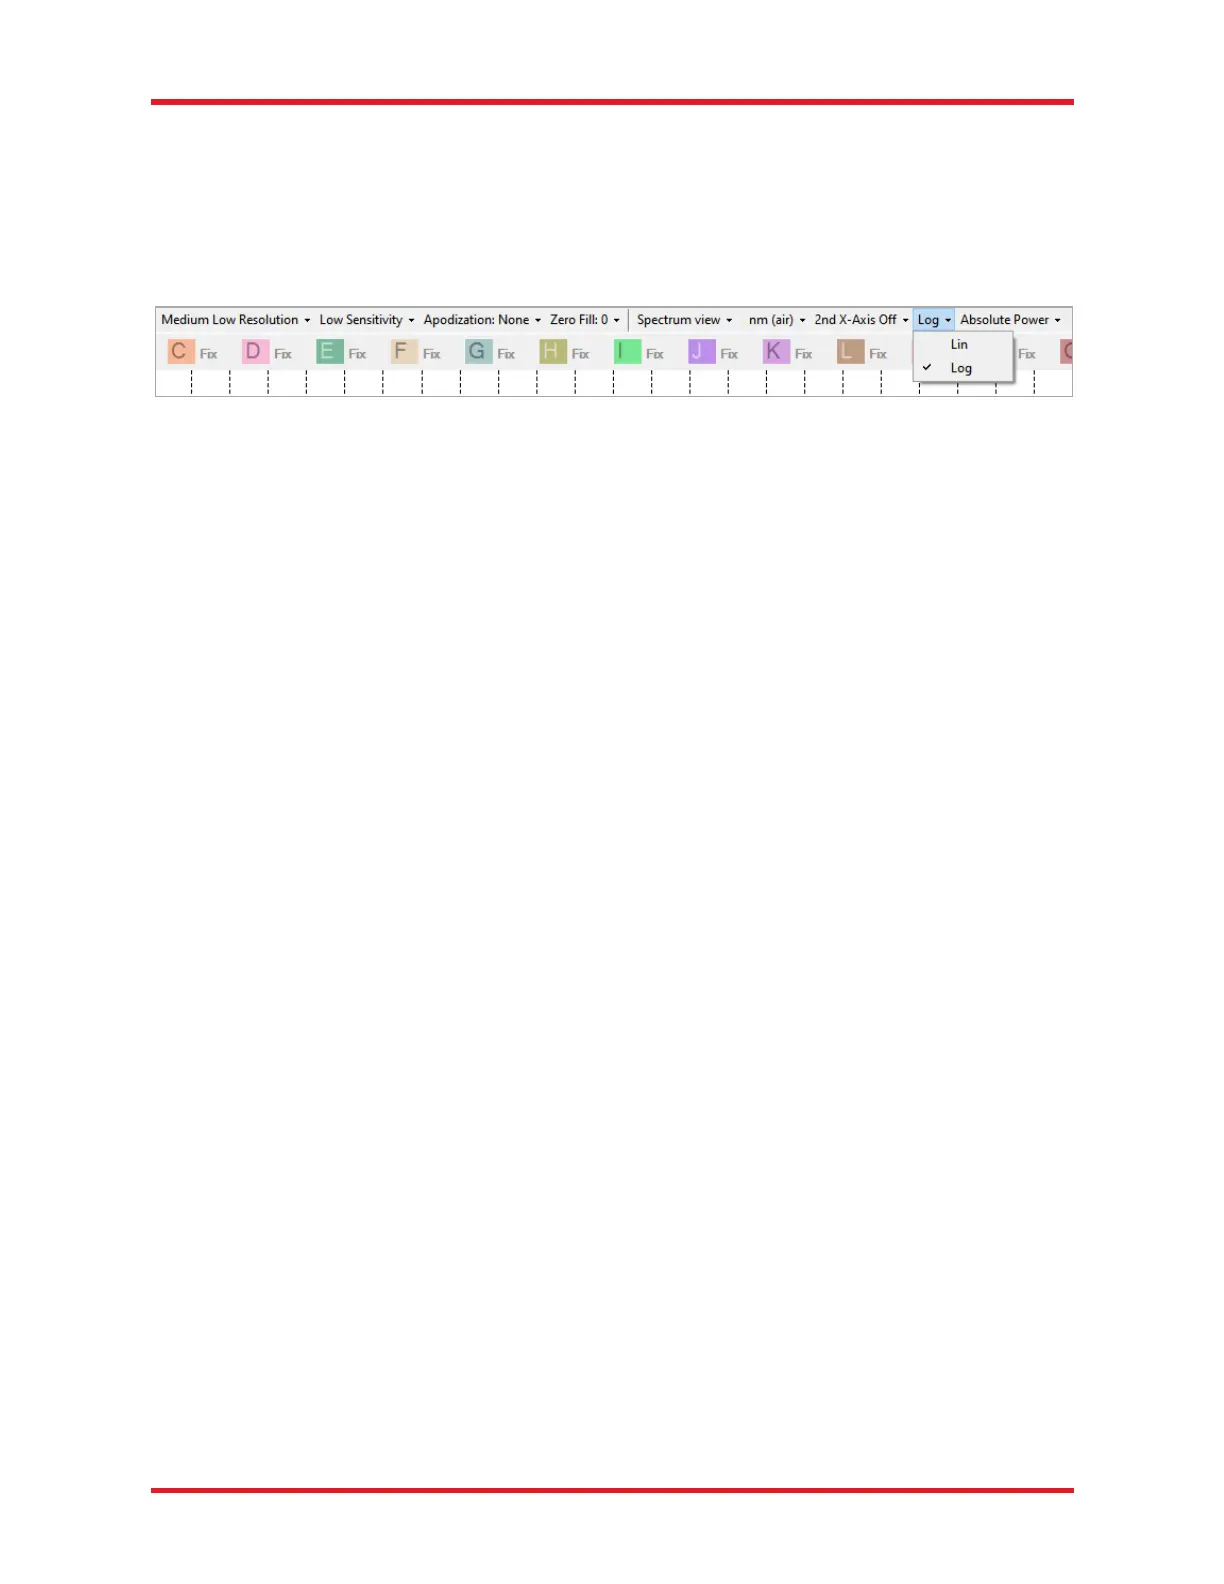
In Spectrum view, the vertical axis is set by default to show optical power in linear scale in mW, but it can also
be set to dBm by selecting “Log” from the vertical axis unit combo box in the settings bar.
Figure 18. Setting the Vertical Axis Unit
7.1.5. Displaying the Interferogram While Working in Spectrum View
Selecting the option “Interferogram View” in the combo box under the Display menu will show a secondary
display area above the main display area. The upper display will show the entire interferogram while the lower
will display the spectrum. This can be useful to see that there are no undesired structures in the interferogram
causing problems in the spectrum.
This option is only available if an OSA is connected to the computer or at least one spectrum/interferogram from
an OSA has been loaded into the software. This option is not available in Basic level.
7.2. Acquiring Data
7.2.1. Acquiring a Single Spectrum/Interferogram
The Redstone OSA305 will acquire one spectrum per detector, which can be shown as a stitched spectrum or
separately. Note that the noise floor of the two detectors might not be at the same level, which presents itself
as a ramp in the spectrum when there is no light in the overlap region. However, the transition is power calibrated
so that the two detector responses match with light input.
7.2.2. Repeated Measurements
The autogain algorithm will continuously investigate the collected interferogram(s) and make slight adjustments
to gain and/or offset to ensure best possible settings. Whenever necessary, such as when the input source
conditions have changed considerably, the Redstone autogain algorithm will run a series of short sweeps to
determine optimal gain and offset settings. An overlay window will appear during this time advising the user to
wait for optimization to complete.
7.2.3. Automatic Setup
The automatic setup routine performs a series of measurements on the unknown light source currently being
coupled into the OSA and adjusts the measurement settings to those most suitable for that source. The settings
that will be adjusted are the resolution (Section 4.8), sensitivity (Section 4.8), apodization (Section 4.10), zero
fill factor (Section 4.11), and gain.
The routine is started by clicking on the “Auto Setup” button under the Instrument menu. It can take up to a
minute to complete, and no other measurements can be performed while it is running.
7.2.4. Averaging Interferograms (Redstone OSA305 only)
The white broadband reference source in the Redstone OSA305 allows for an exact determination of the ZPD
position. This makes it possible to average interferograms, which has the same main effect as averaging
spectra.
7.2.5. Signal
Signal analysis inspects the amount of light entering the spectrometer. This window is useful for alignment
purposes.

 Loading...


