Optical Spectrum Analyzers Chapter 7: Software
Page 23 STN053070-D02
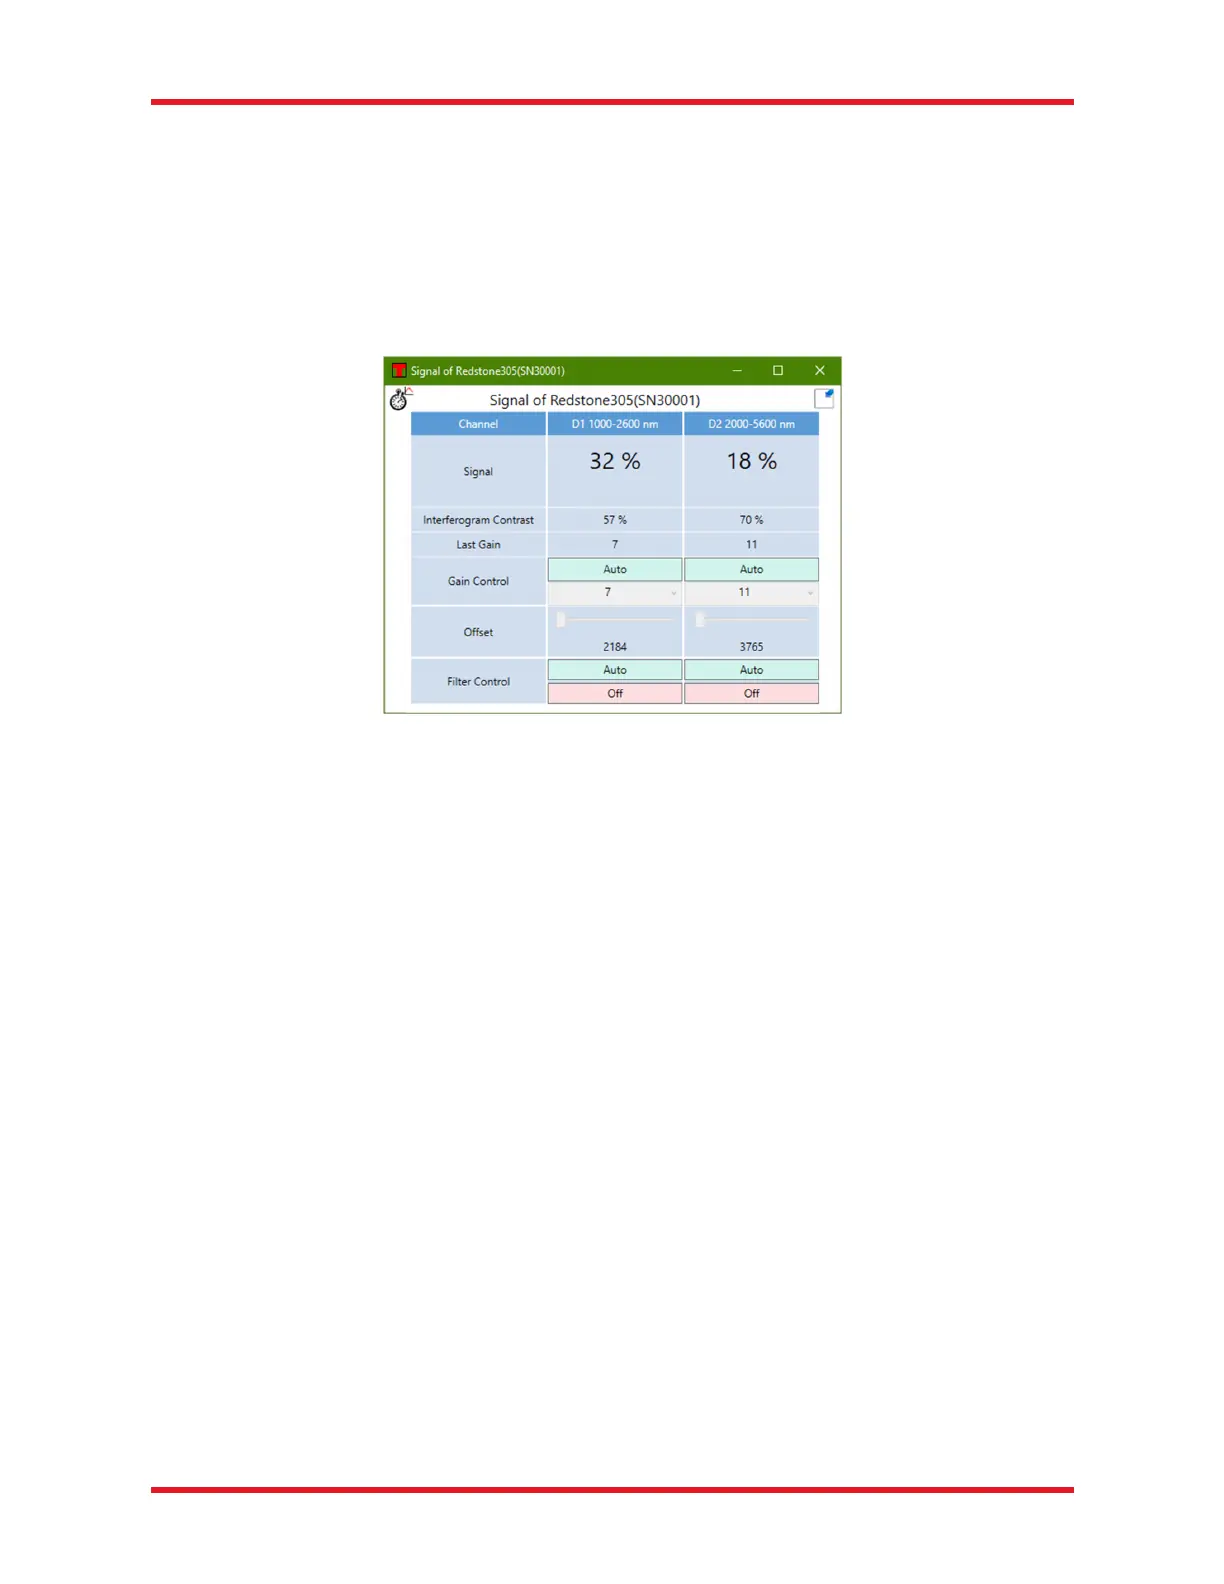
The Signal window displays for each detector, in large type, the percentage of the full range that was used by
the last acquired interferogram. This information can be used to determine whether the interferogram is
saturated or whether the interferogram contains too little light for the measurement to be useful.
Further information displayed is the interferogram contrast (defined as the difference between the maximum
and minimum intensities divided by the doubled average intensity), the most recent gain level used, a control
switching between automatic and manual gain modes, the current gain and offset levels, and controls for the
attenuation filters (Redstone OSA305 only).
The analysis results are displayed in a floating window or docked below the main display area.
Figure 19. Signal Window
7.2.6. Measurements of Pulsed Sources
While a Michelson interferometer depends on the input light not changing properties during a measurement, it
is possible to measure pulsed sources with a Thorlabs OSA under certain circumstances. The pulses will
introduce artifacts – so called spectral ghosts – in the spectrum, but if the repetition rate of the input light is
higher than about 7 kHz (Redstone OSA305) or 30 kHz (OSA20xC), the spectral ghosts will be pushed out from
the vicinity of the true peak and the spectrum of the pulsed light will be close to that of a corresponding CW light
source, even using a normal Single or Repeat measurement.
For those cases, in which the spectral ghosts are interfering with the true spectrum, the Pulsed Source
Measurement mode can help improve the result. To start this routine, click the “Pulsed” button located under
the Instrument menu, noting that this routine will overwrite the current settings for and data in traces A through D
(Redstone OSA305) or through E (OSA20xC).
In order to perform a Pulsed Source Measurement, the software switches to Spectrum view, and sets the
number of averaged traces to 1000. The OSA is then cycled through all available sensitivity modes and rolling
averages of the spectra in each sensitivity mode are stored in traces A through C or D. The last trace, which
represents the final measured spectrum of the pulsed source, is generated by comparing the preceding traces
and retaining the minimum measured value in each data point.
The pulsed measurement will run repeatedly until the “Stop” button is clicked. Note that there can be a delay
after the “Stop” button is clicked until the measurement is actually stopped.

 Loading...


