Optical Spectrum Analyzers Chapter 4: Description
Page 11 STN053070-D02
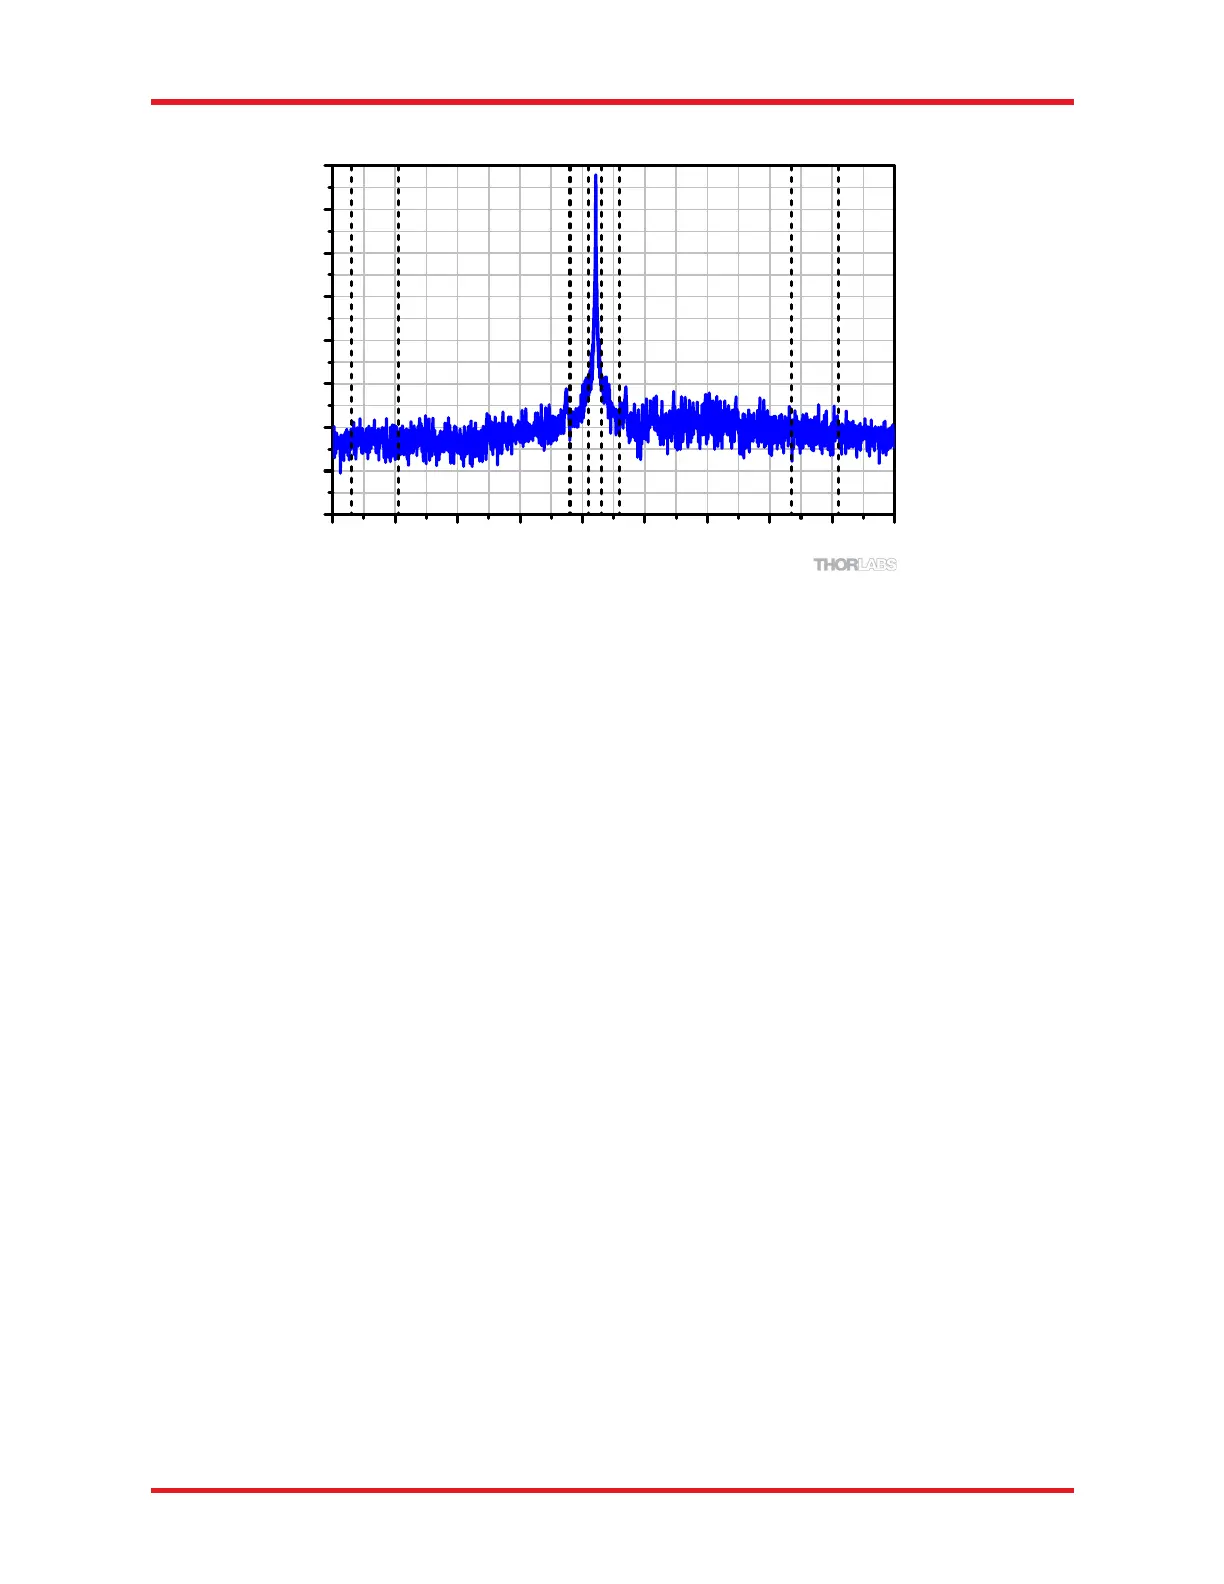
Figure 6. Spectrum of a 1532 nm Frequency-Locked Laser measured by a Redstone OSA305. The
vertical lines represent where the ORR is measured.
4.10. Apodization
According to Fourier theory, the spectrum of the unknown input light can be exactly determined from the Fourier
transform of the measured interferogram, but only if the interferogram is acquired over an optical path difference
extending from zero to infinity. Of course, the mirrors in the OSA can only translate through a finite distance.
We have therefore implemented several apodization functions in the ThorSpectra software to account for the
effect of the finite path length on the measured interferogram.
The measured, finite interferogram can be thought of as an ideal, infinite interferogram that consists of measured
values over a short interval (say, 𝐿 to 𝐿) and is equal to zero everywhere else. This treatment is equivalent
to multiplying the measured interferogram (which has measured values from –𝐿 to 𝐿) by a boxcar function that
is equal to 1 from –𝐿 to 𝐿 and is equal to zero everywhere else. Mathematically, the Fourier transform of the
product of two functions (i.e., the interferogram and the boxcar function) is equal to the convolution of the Fourier
transform of the first function (i.e., the interferogram) with the Fourier transform of the second function (i.e., the
boxcar). That is, if 𝐹𝑓 is defined as the Fourier transform of 𝑓, then
𝐹
𝑓 ∙𝑔
𝐹𝑓∗𝐹𝑔
The Fourier transform of the interferogram is the spectrum, and the Fourier transform of a boxcar function is the
sinc function: sinc𝑥≡sin 𝑥/𝑥. The sinc function is an oscillating function with diminishing amplitude away
from zero. Therefore, the Fourier transform of a measured, finite interferogram yields the exact spectrum, but it
is convolved with additional periodic structures that are not representative of the unknown input light.
The effect of the additional periodic structures is strongest when measuring a narrowband source, because the
amplitude of the interferogram of a narrowband source is high over the entire measurement range. To remove
the structures, the interferogram is multiplied by apodizing (dampening) functions that decrease the amplitude
of the interferogram close to the edges of the measurement range. This reduces or removes the artificial ringing
at the expense of reducing the resolution of the final spectrum.
For a detailed description of the apodization functions implemented in the ThorSpectra software, please see
Section 14.2 Apodization Functions.
4.11. Zero Fill
Zero filling is the process of extending the interferogram with zeros. This effectively interpolates the spectrum
by adding more data points between the measured data. It is especially interesting for spectra that contain sharp
1524 1526 1528 1530 1532 1534 1536 1538 1540 1542
-70
-60
-50
-40
-30
-20
-10
0
10
1532 nm Frequency-Locked Laser Spectrum
Normalized Power (dB)
Wavelength (nm)

 Loading...


