5.6 Results
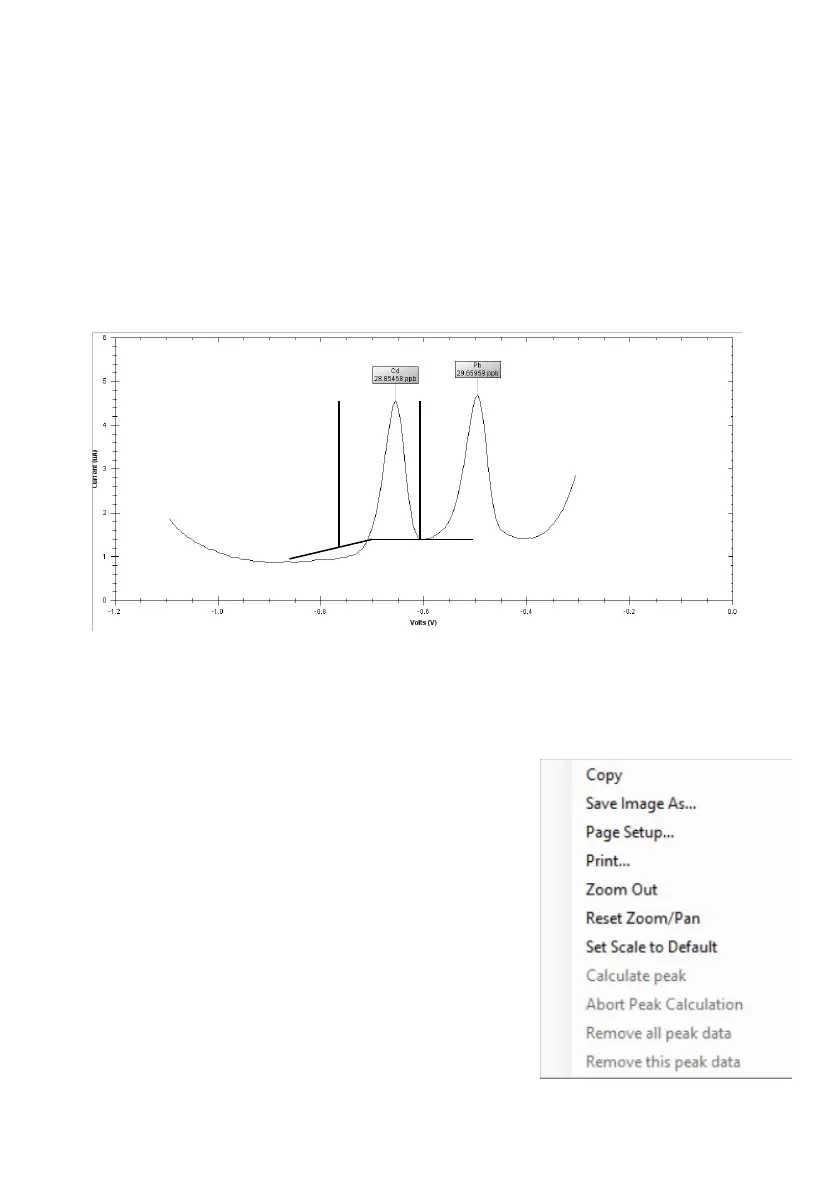
Following the analysis, a graph known as a voltammogram will be displayed.
This is a plot of output current vs applied potential. If the metals of interest are
present in the sample, peaks will be seen in the data. The peaks will
automatically be labelled with the metal name and the concentration value
calculated and displayed.
The voltammogram below shows a typical result for an M1 analysis.
The two peaks displayed are for cadmium and lead.
Basic graph functions:
Right clicking the mouse whilst hovering over the graph will show the following
options:
• Copy: Copies the graph to the Windows clip board.
• Save I
mage As: Saves the image as a graphics file.
• Pag
e Setup: Setup the printing options.
• Pri
nt: Prints the graph to a selected printer.
• Zoom
Out: Zooms back out one zoom step.
• Reset Zo
om: Restores the viewing window to the default
setting.
• Set
Scale to Default: Restores the axis to the default
values.
Metalyser® Field Pro HM3000 Instruction Manual v 5.0
 Loading...