30 RT-SVP011A-EN
Reports
order to make room for the newest data.
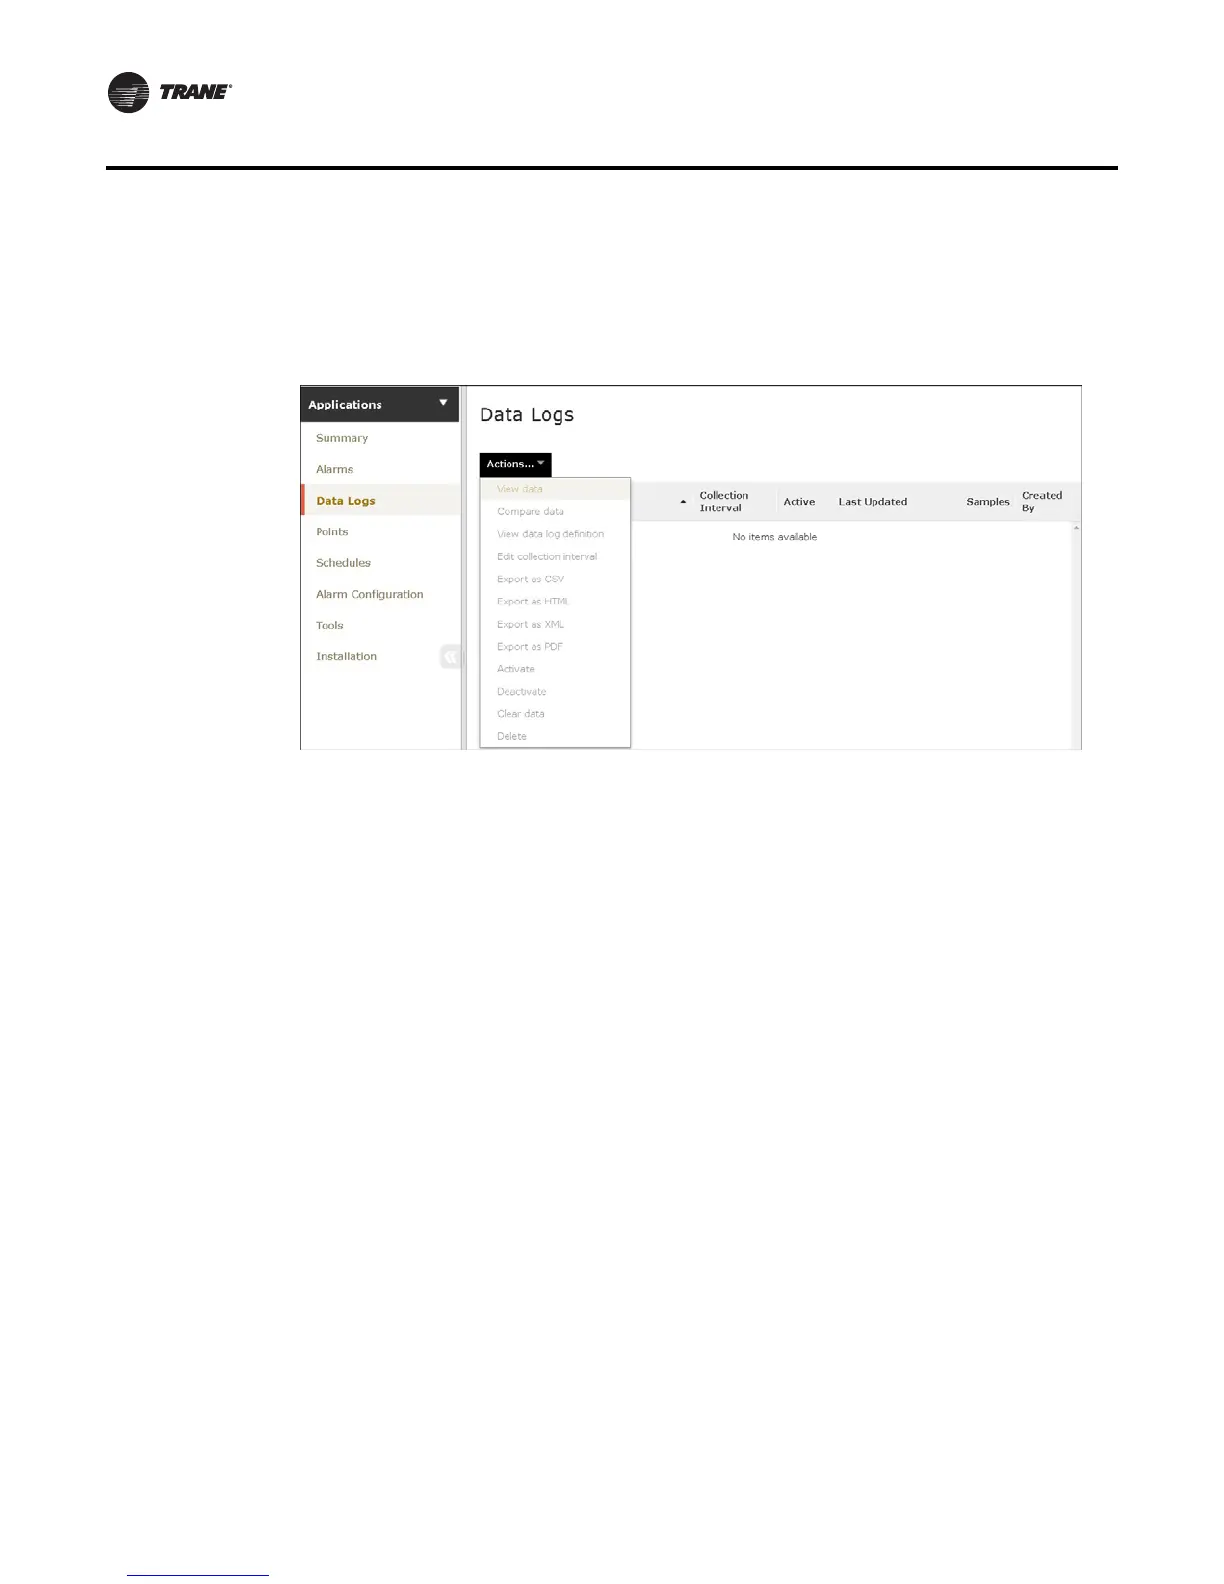
A list of data logs can be accessed by clicking Data Logs from the left navigation menu. From this
page you can take action on a data log, such as comparing or exporting, by selecting one or more
data logs and then clicking the Actions button.
Figure 26. Web UI Data Logs
Using the Trend Viewer
The trend viewer displays trend data in a chart. The trend viewer supports a time comparison mode
that allows you to compare trend data at different points in time (day-to-day, month-to-month, year-
to-year). A maximum of six data logs are supported (up to two data logs when time comparison
mode is enabled). A maximum of two types of dimensionality are supported on the left and right
y axis. Samples are plotted on a date/time scale on the x axis. Samples in fault (due to
communication loss) are not plotted and will result in an interpolation gap within the plotted line.
If all samples are in fault, no line will be displayed.
The trend viewer is available on the data logs tab of status pages for equipment and systems. To
view trends graphically, select up to six data logs from the Data logs page and then select View
datafrom the Actions button.
 Loading...