Instrument Operation 5-13
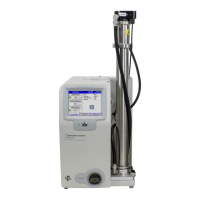
Histogram data
within the View
Boundaries is
displayed in blue,
and data outside
of View
Boundaries is
displayed in gray.
The statistics
displayed on the
SMPS screen use
only data within
the View
Boundaries. Note
that this differs
from the statistics
in exported data files, which relate to the entire size range regardless of
View Boundaries.
When View Boundaries are set to Max (default setting), all histogram data
will be displayed in blue.
Scan Size Range Min/Max
Light blue vertical lines indicate the size range over which the SMPS is set
up to scan. The scan size range is set up on the Setup > Properties > Scan
tab.
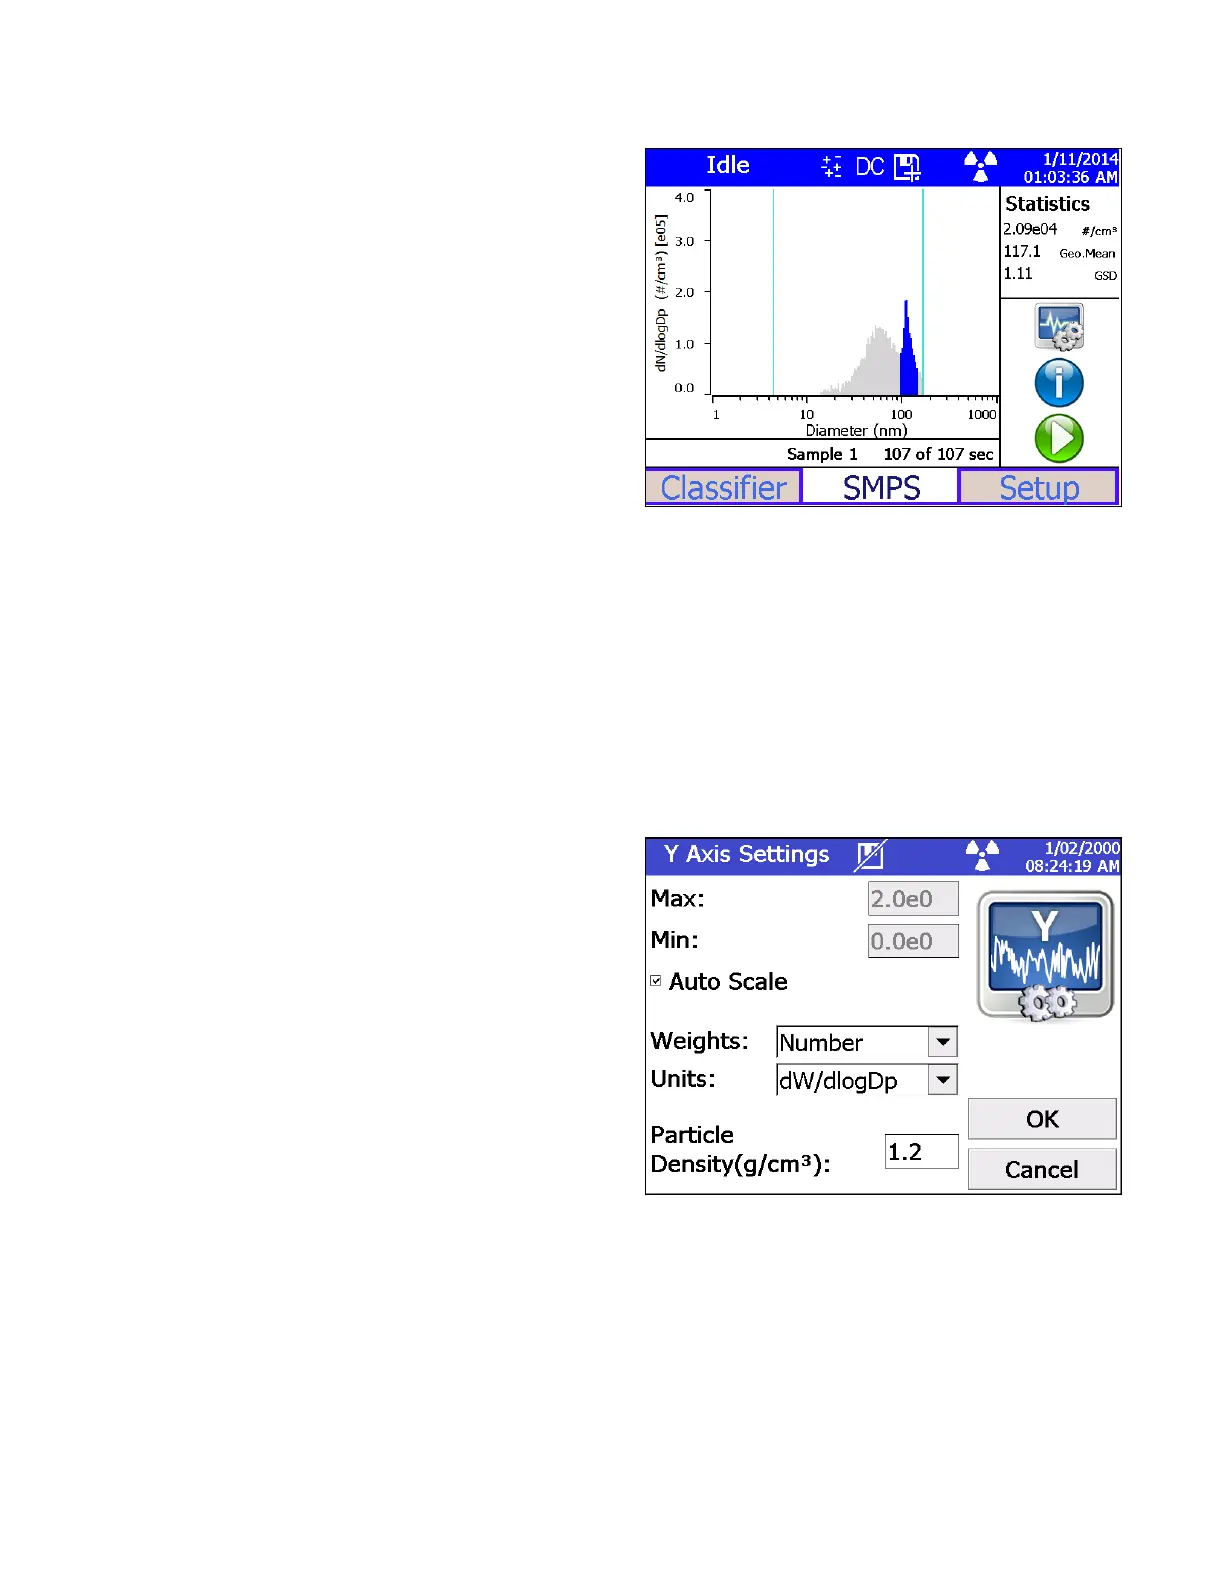
Specifying Y-Axis Settings
Touch the Y-axis
to see the y-axis
settings menu.
 Loading...