Setting up the Edge via Detection Management Software 3-3
Logging
EG-4P model only logs at one minute intervals and includes the following
measurements:
Meter 1 logs Lavg/Leq, Lcpk, and L
ASMX
Meter 2 logs Lavg/Leq
If the dosimeter runs for one hour, then it will log 60 Lavg/Leq results,
and 60 L
ASMAX
/Lcpk levels. In DMS, you can customize the logged data
chart results by checking Lavg/Leq, Lcpk, and/or L
ASMAX
measurement
values when using the button.
Views on the Edge
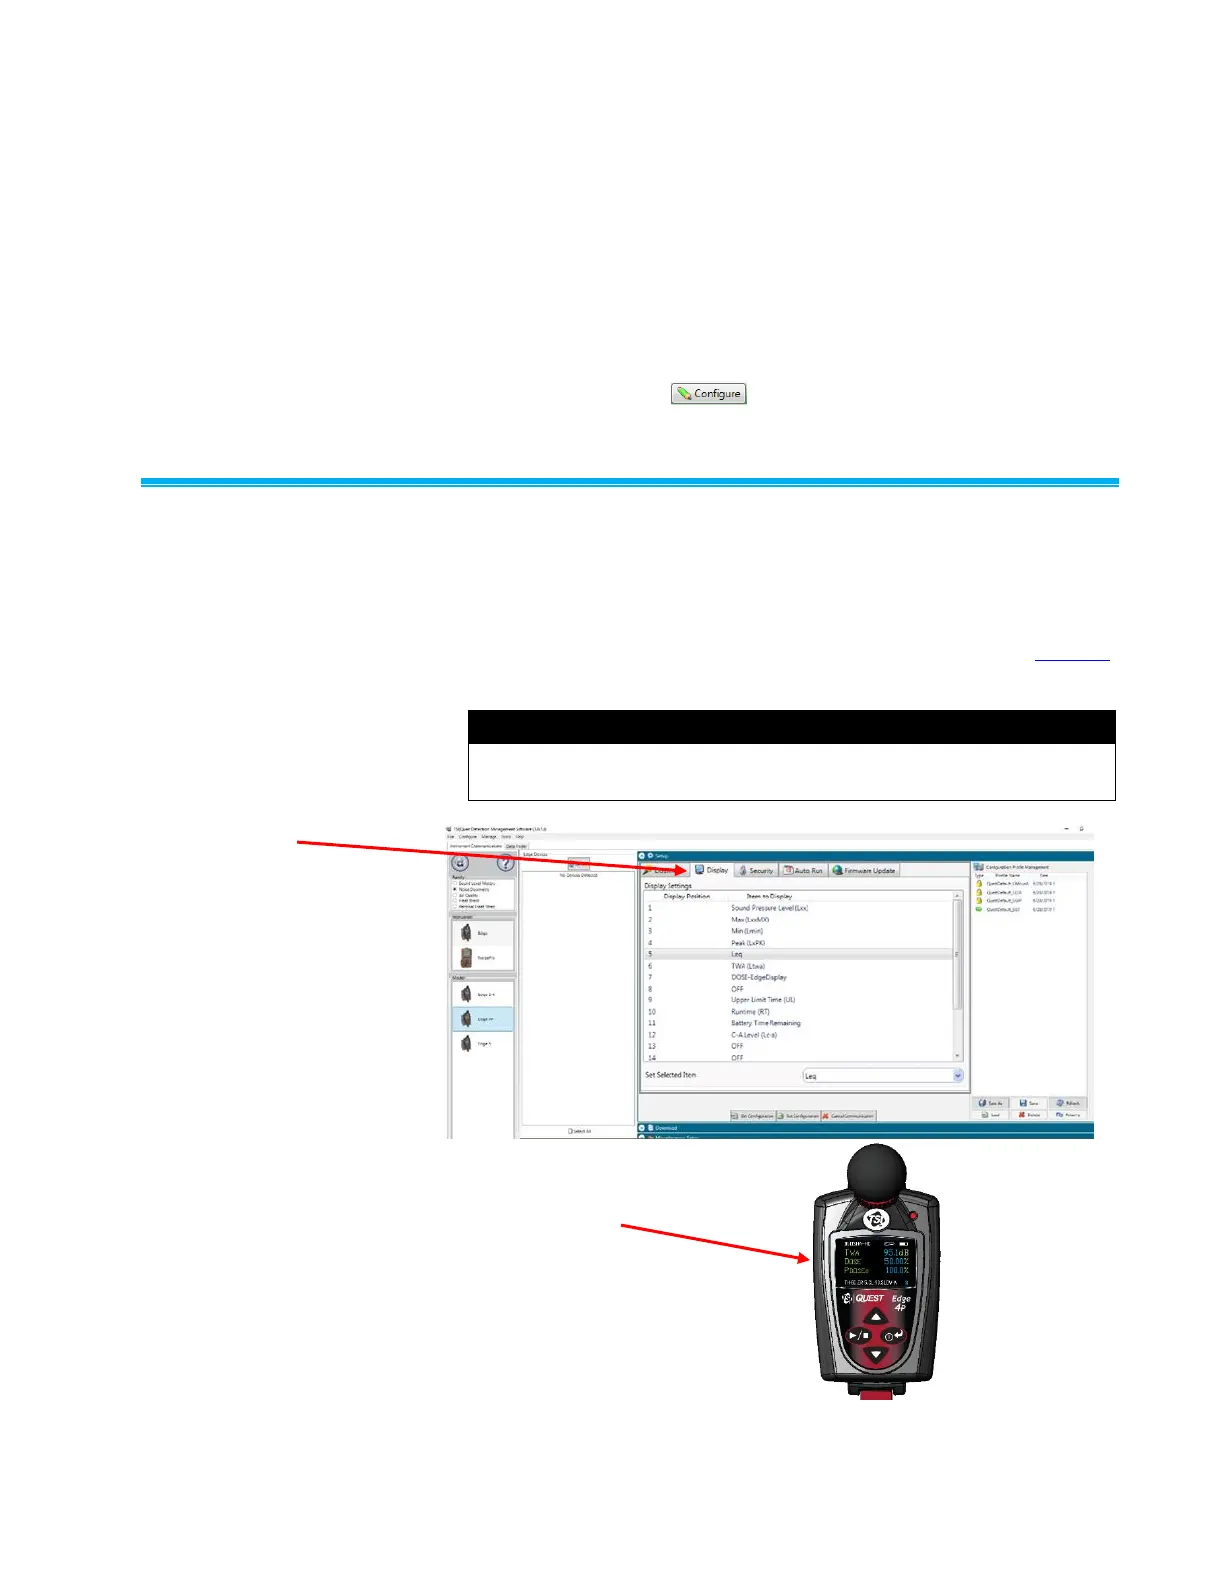
The Edge is a user-friendly and customizable dosimeter. In DMS, you
may select the appropriate measurement values or views to appear or
not appear on the display of your dosimeter using the Display Setup
configuration as displayed below. Table 3-1 briefly identifies the
displayed data values and views with a brief definition. (See the glossary
for additional information of these terms.)
The measurements/parameters are viewable in charts and graphs in
DMS when downloaded.
Edge: customize
what appears on
the display
Measurements/parameters which
appear on the Edge
Figure 3-4
Customizing Display View
 Loading...