Viewing your Studies in Detection Management Software 5-5
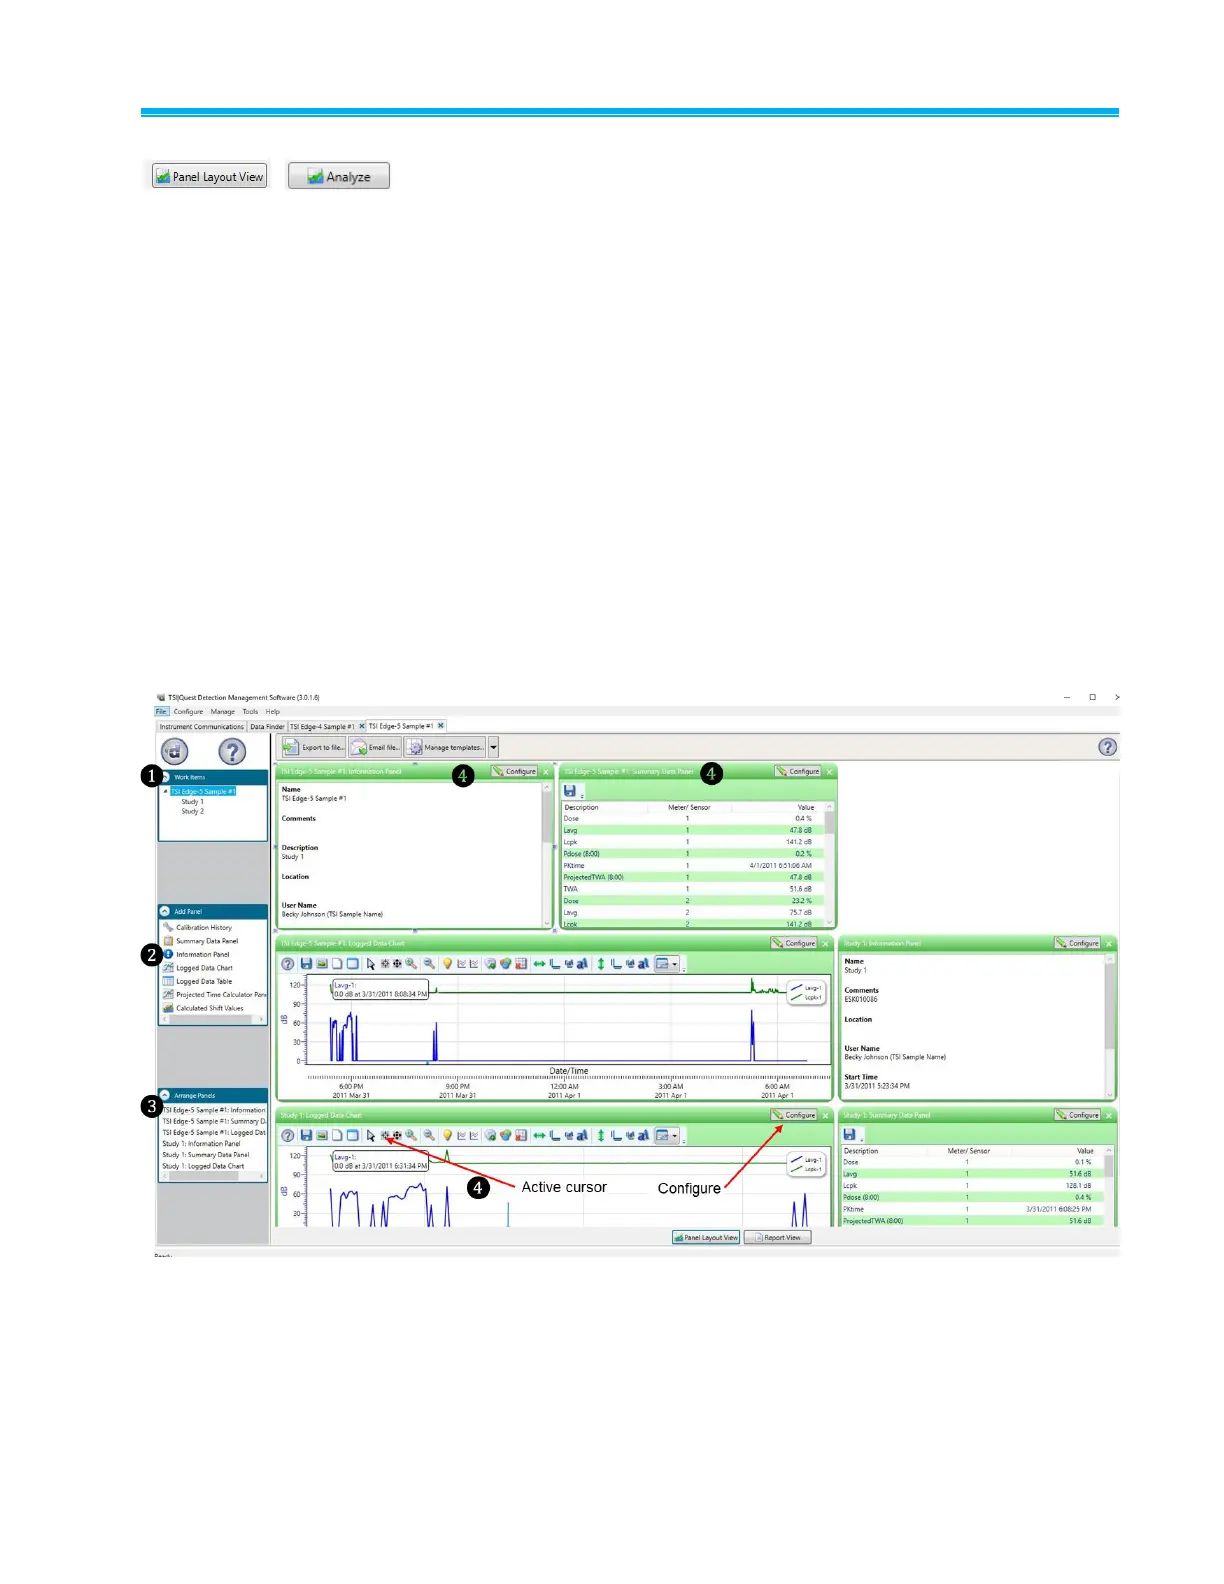
Panel Layout View (charts/graphs)
When you are in the data finder page (see above), select either the
Analyze button or double-click on a session/study to view the data in
charts and graphs as displayed in Figure 5-7. The measurements and
parameters will be displayed in charts and graphs which may be
customized for analysis and/or reporting purposes.
1. In the panel layout view page, it is divided into Work Items (see 1),
Add panel (see 2), Arrange Panels (see 3) and data panels (see 4).
Work items (1)—select either the session or study (in order to
view appropriate measurement/parameter data).
Add panel (2)—double-click on a chart/table type and it will
appear as a panel on your screen.
Arrange panels (3)—displays the order of the sessions/studies
displayed in the panel section of your screen.
Data Panels (4)—used to view your measurement and/or
parameters from your study.
NOTE: Use the menu bar icons and/or configure icon to
customize parameters.
Figure 5-7
Panel Layout View (viewing the data in charts and graphs)
 Loading...