USER GUIDE
Control Operation
Figure 43: Setup Options
Press the Load File tab on the right top of the screen (see
Figure 43).
A le window appears, allowing you to nd the le
indexCycle.arg in the haccp folder. This is the folder
extracted from the haccp.zip le downloaded from the USB
Touch Screen (see Figure 44). Click on the folder name to
go to the path haccp\home\root\haccp
Figure 44: Home Folder
After the .arg les appear in the box, double click on
indexCycle.arg
Figure 45: Files Display Box
Select the cycle to graph from the Load le colum, based
on the date, starting hour and cycle code (see encoding
scheme). See an example of cycle graph in Figure 48. Right
click on the graph to print or save a .png le. Scroll up or
down to zoom in and out. To zoom in a specic area of the
graph, just select the area with the mouse.
Access the source HACCP les for own purpose
The tracer software is a powerful tool that can graph the
cycles stored in the Blast Chiller memory. However, it is
possible to open the .csv source les to check data (see
Figure 46). Access the .csv les directly from the haccp
extracted folder. Open the desired cycle with Excel or
an equivalent spreadsheet software. The data appears
similarly to this table:
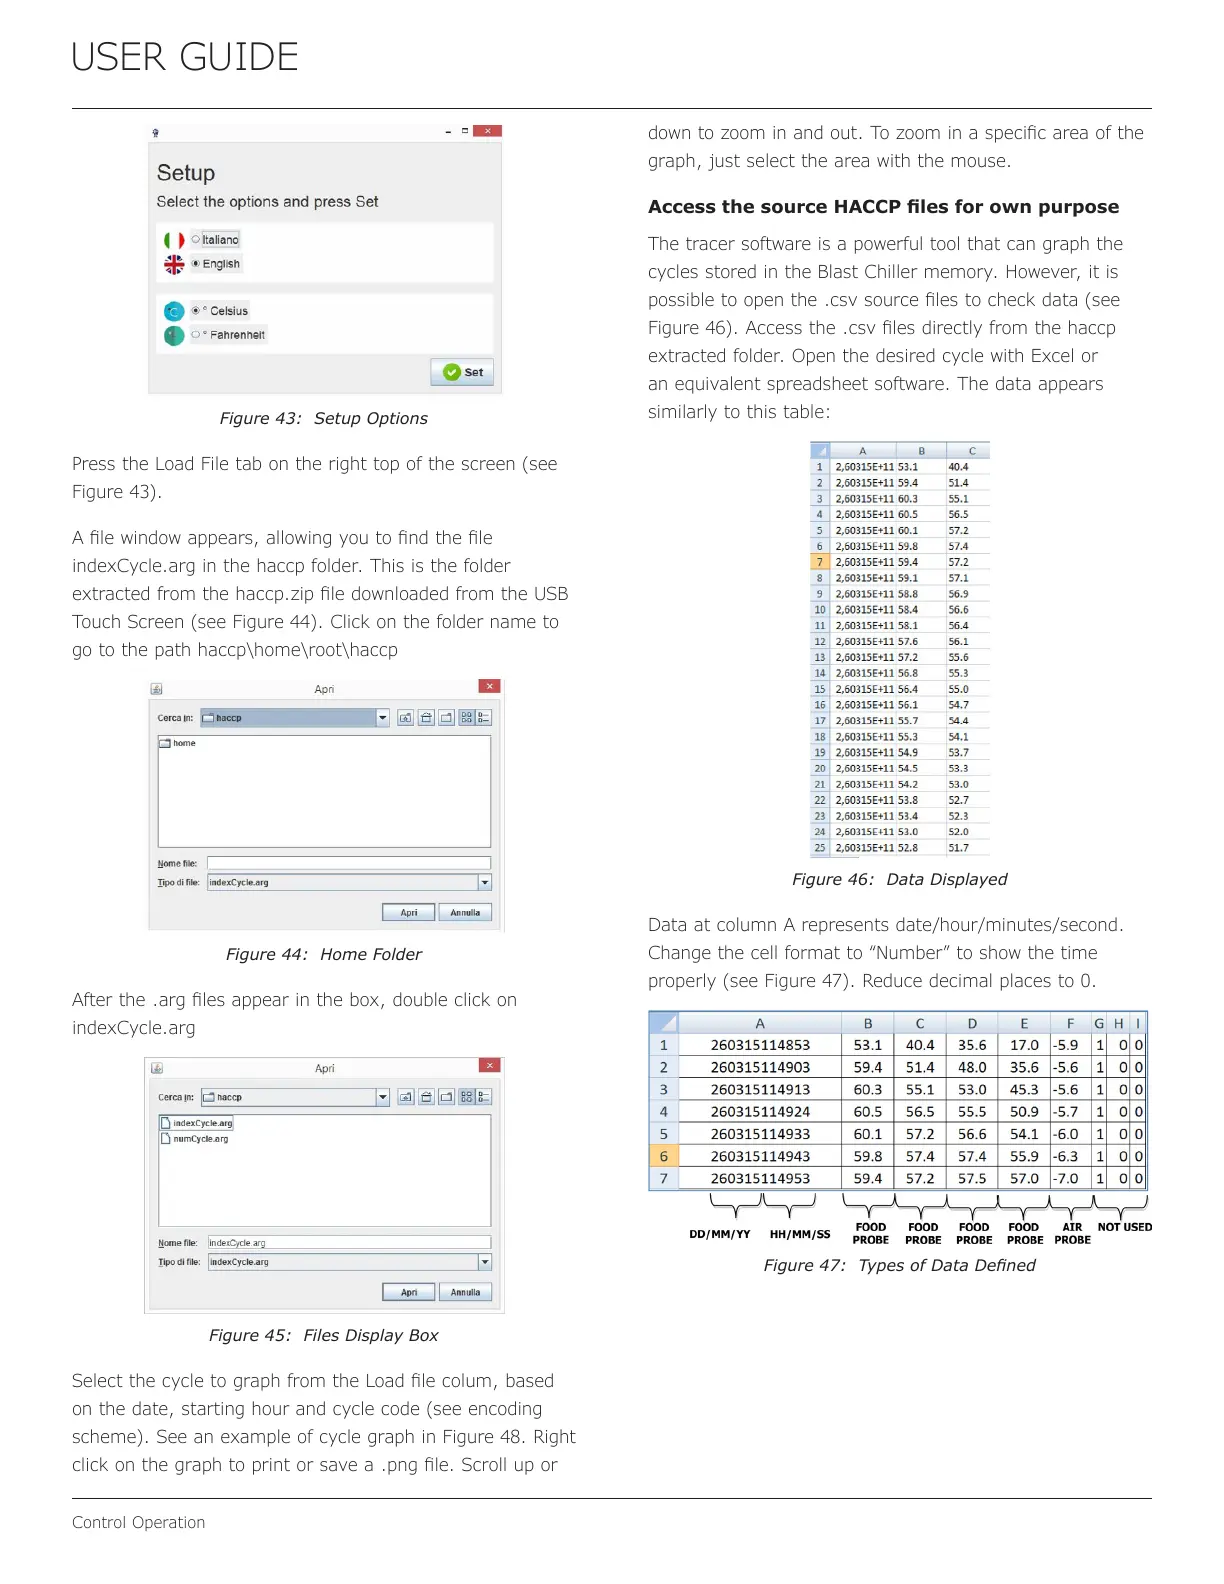
Figure 46: Data Displayed
Data at column A represents date/hour/minutes/second.
Change the cell format to “Number” to show the time
properly (see Figure 47). Reduce decimal places to 0.
Figure 47: Types of Data Dened
28
 Loading...