EasyManuals Logo

YDLIDAR G2 User Manual

YDLIDAR G2
18 pages
To Next Page IconTo Next Page
To Previous Page IconTo Previous Page
Page #10 background imageLoading...
Page #10 background image
Copyright 2015-2021 EAI
FIG 15 LOCK MOUSE TRACKING
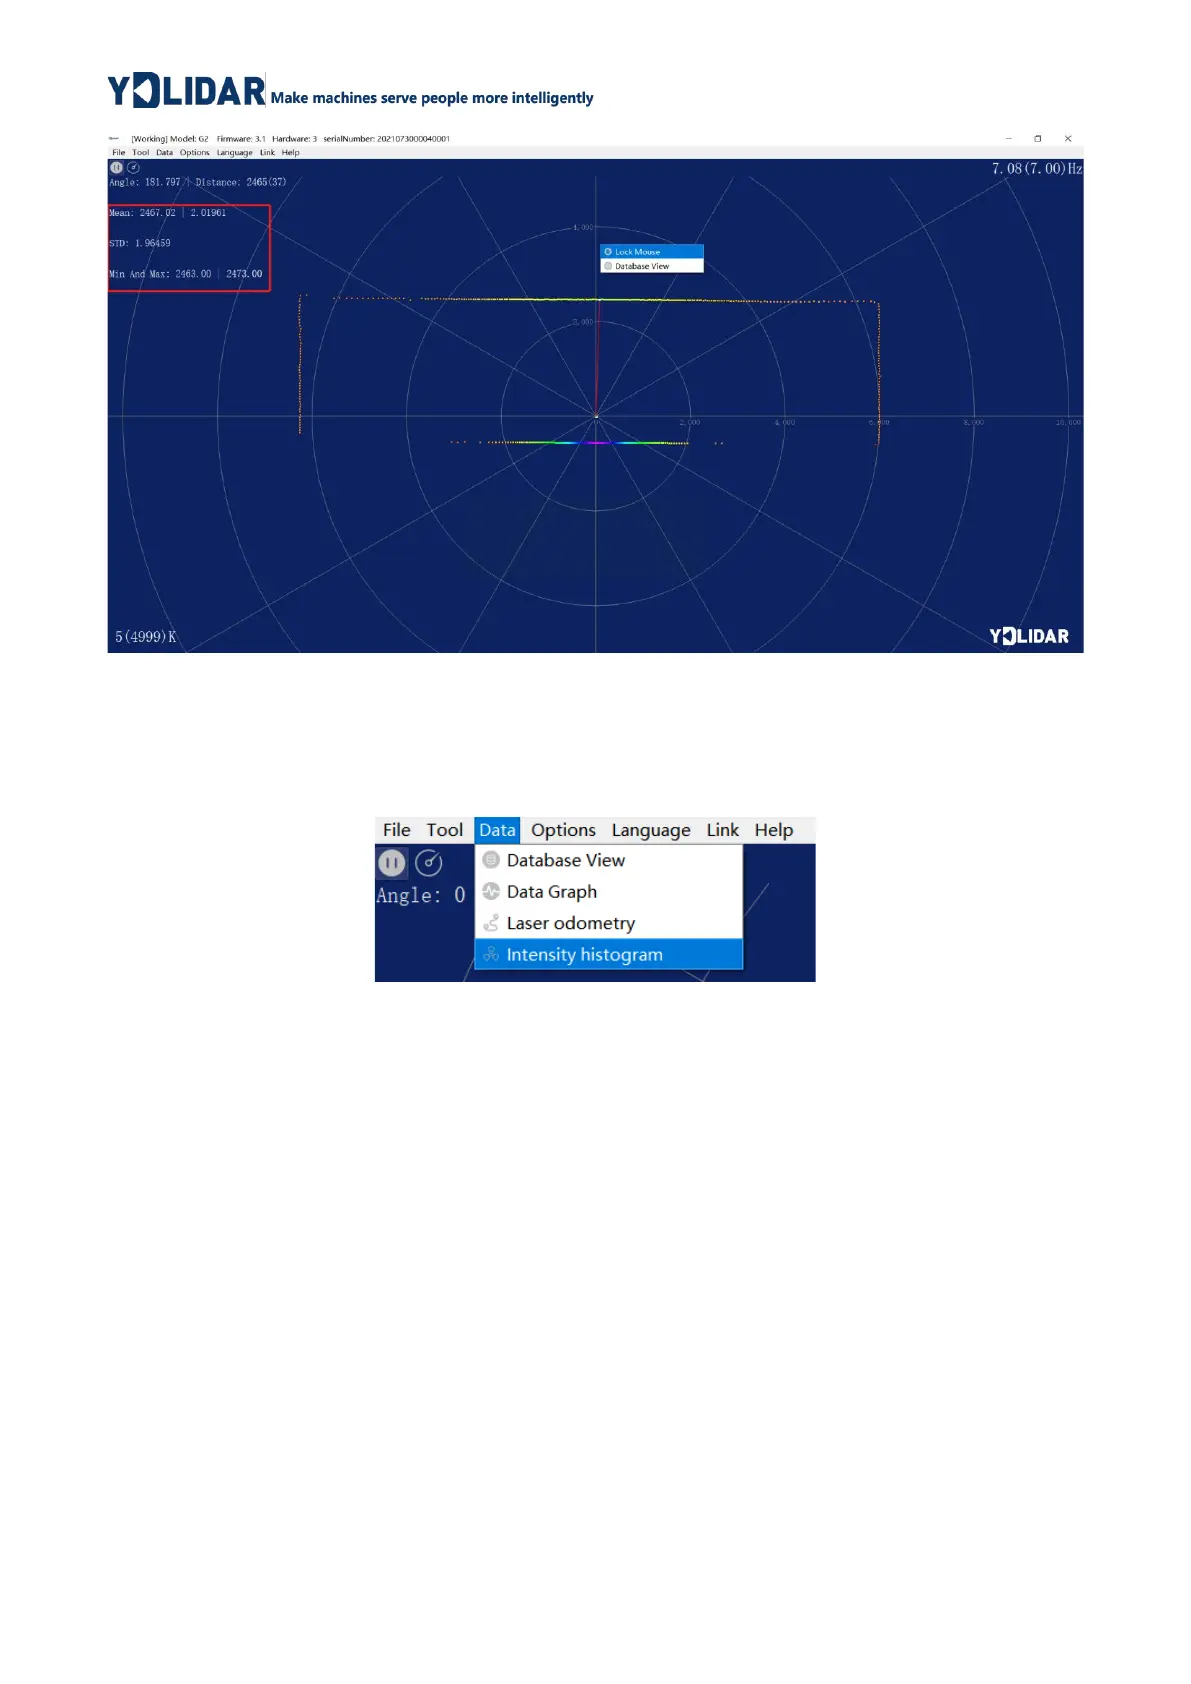
2.3.5 Display Intensity Value
Click [Data] in the main menu and select [Intensity histogram].
FIG 16 DISPLAY INTENSITY VALUE
The main window is displayed as follows, the intensity values of a total of 100 points on
the left and right of the mouse lock position.

Questions and Answers:

Question and Answer IconNeed help?

Do you have a question about the YDLIDAR G2 and is the answer not in the manual?

YDLIDAR G2 Specifications

General IconGeneral
BrandYDLIDAR
ModelG2
CategoryAnalytical Instruments
LanguageEnglish