44
APP PROGRAMMING
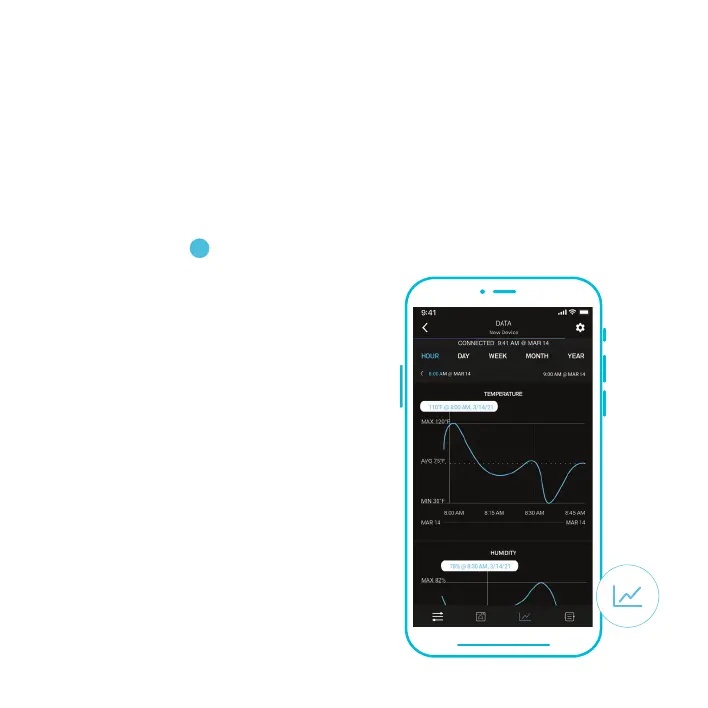
DATA TAB
Logs and stores all temperature and humidity information. Readings are displayed in
fluctuation charts and bar graphs and can be viewed in hours, days, weeks, months,
and years. Data can be exported as a spreadsheet and sent to other devices by tapping
EXPORT CSV DATA.
The Fluctuation Charts readout displays the
detected temperature or humidity over a given
timespan. Swipe left or right to scroll through
the readings. As you scroll, the dotted line
will move up or down and display the average
reading of the timespan you selected.
The maximum reading of the given time span
is displayed at the top of the chart, while the
minimum reading is displayed at the bottom of
the chart.
1
Toggle to the numbered port view to see a single device's
status and temperature/humidity over a given timespan.