45
APP PROGRAMMING
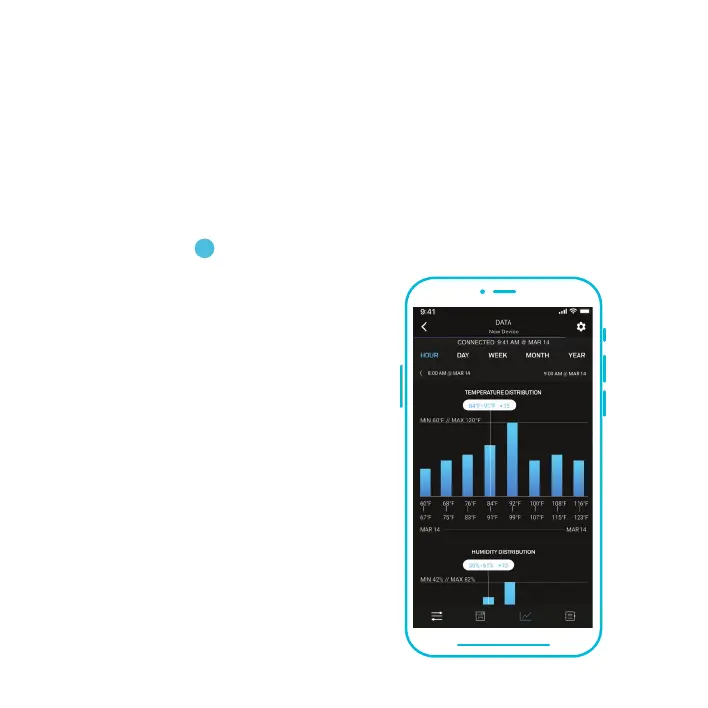
DATA TAB
The fluctuation charts and bar graphs allow you to see trends in temperature and
humidity and enable you to make the necessary adjustments to your space. Tap on any
point in the charts and graphs to see detailed information on the picket.
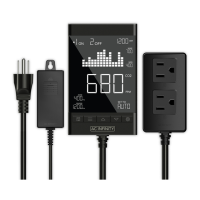
Bar Graphs - This readout displays how often a
detected temperature or humidity point occurs
over a given timespan.
The minimum and maximum readings of the
given timespan are displayed at the top of the
graph.
2