29
PD201806 AEG GRID-TIED SINGLE-PHASE SOLAR INVERTER V.1-18 EN
29
Text Parameter
Display Area
Fault Code MenuStatus Area
Curve Graphic
Display Area
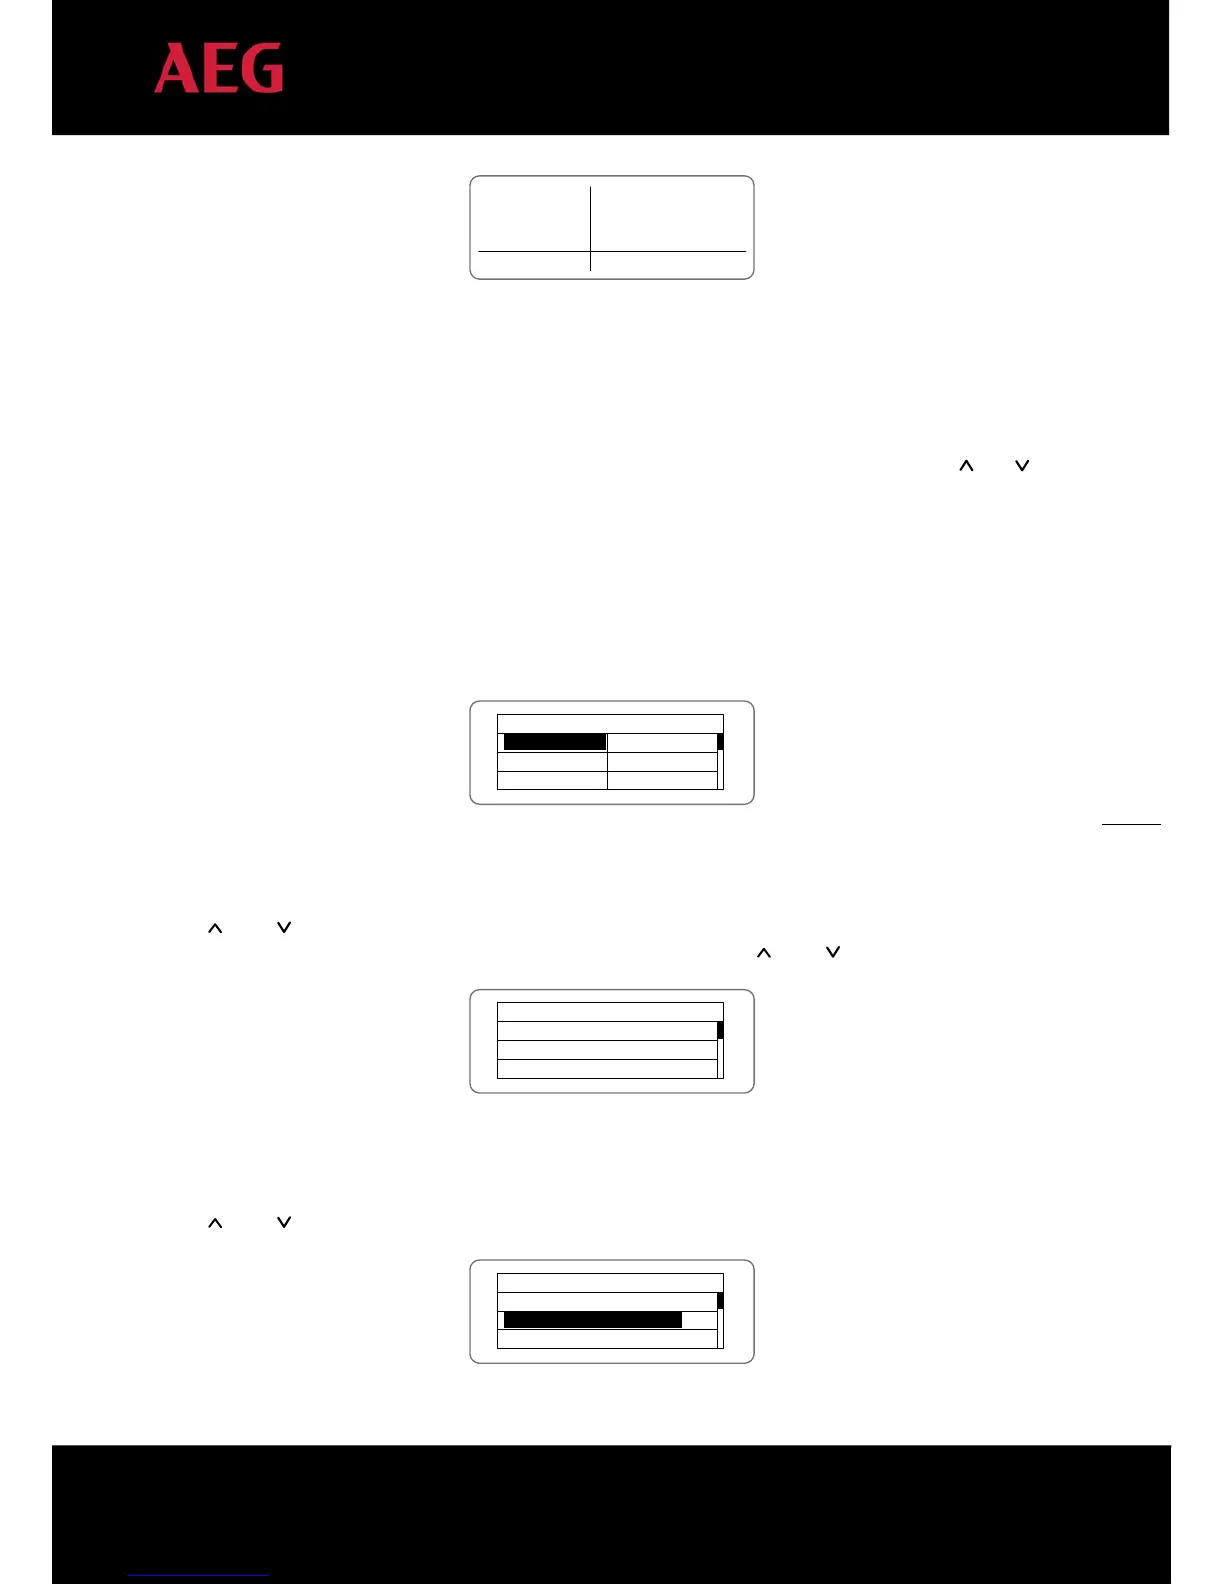
Figure 16: Main interface
Figure 16 above shows the main interface of the LCD screen. The LCD screen displays the following items:
1. Curve. The curve displays the power generation on the current day;
2. Current key parameters of the inverter: three lines of words are displayed at a time, but if the inverter is in
operation or stand-by state, the words are rolling forward in 3s interval. The user can press “
” or “ ” to
look the desired information up;
3. 5 inverter states;
4. Fault codes. If the inverter is in fault or warning state, up to 8 fault codes can be displaying on the screen.
5.4 Functions operation
Most of the parameters can be viewed and set through the LCD screen and operation panel.
Main Menu
Monit Param
History
Statistics
Setup
System Info
Fault Info
Figure 17: Main interface
5.4.1 Monitoring parameters
Press “
” and “ ” in the main interface to select Monitoring Parameters (“Monit Param”), and then press “ENT” to
view the parameters shown in figure 18. Go the front or next window through “
” and “ ” and return through “ESC”.
Current State
E-tod: 0Wh
$-tod: €0.00
P-in : 0.00kW
Figure 18: Monitoring parameters
5.4.2 History
Press “ ” and “ ” in the main interface to select “History”; press “ENT” to view the parameters shown in figure 19.
History 0
2012/01/05 11:32:16
A005: Grid under freq
Figure 19: History parameters