13
VENTILATION CURVES
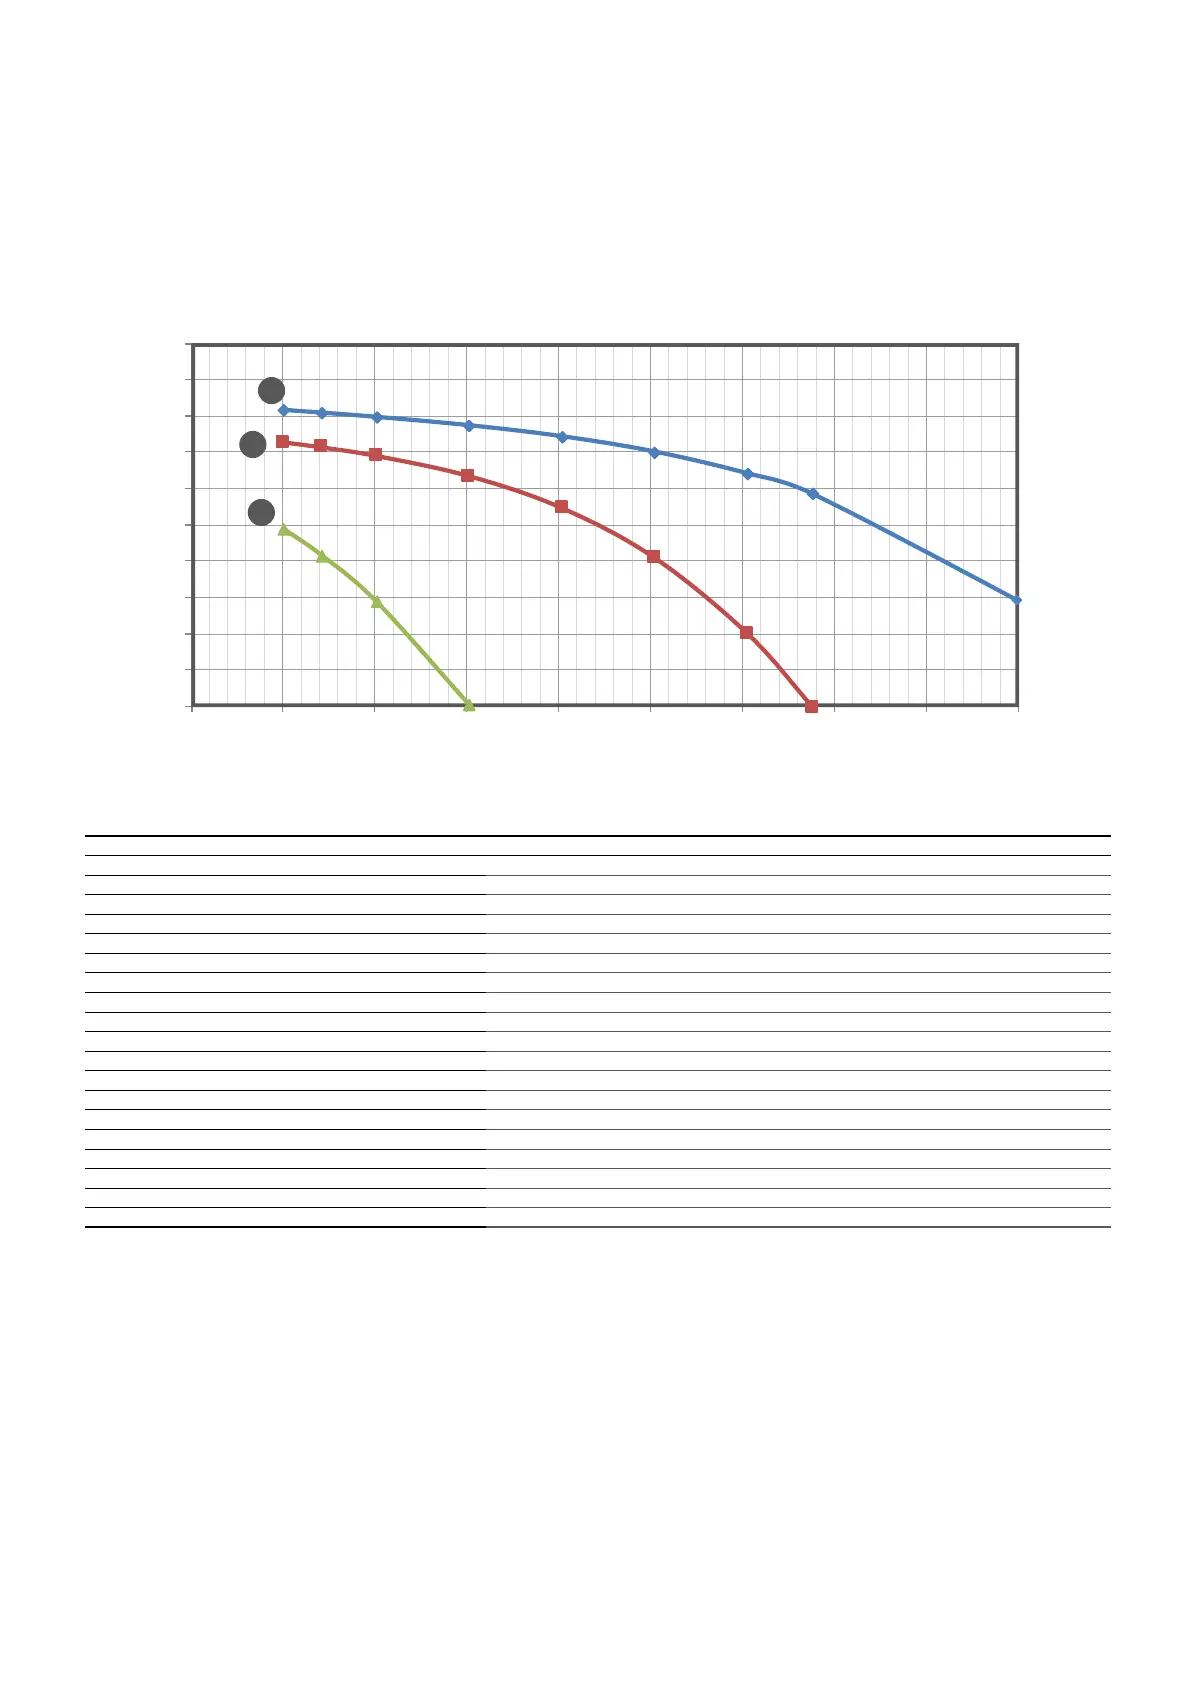
The following diagrams show the ow rate-useful static pressure curves (at vent) of the units, with 4-row coil and with a 0% clogging degree of
the G4 lter.
For units with dierent congurations or accessories, reduce the useful static pressure with the pressure drop values of the added components. The
values of these pressure drops can be found on the tables below the charts.
TA 09 4R
Description
Notes
Accessory
Air ow rate
m
3
/h 400 500 600 700 800
Intake grid GAP Pa -4 -7 -9 -12 -15
Anti-freeze damper SAP Pa 0 0 -1 -1 -1
Intake silencers SSL Pa -6 -10 -13 -18 -22
Return fan VRF Pa 435 414 404 364 253
Mixing chamber with 3 dampers M3S Pa -1 -1 -2 -3 -3
Mixing chamber with 2 dampers M2S Pa 0 0 -1 -1 -1
Mixing chamber with 2 front dampers S2Z Pa -1 -1 -2 -2 -3
∆ pressure drops between the 4R and 6R coil
Pa -3 -5 -7 -8 -11
2R Water post-heating coil 2RPR Pa -11 -16 -23 -30 -38
1R Water post-heating coil 1RPR Pa -3 -5 -7 -9 -11
Electric Post -Heating Coil PBE Pa -2 -3 -4 -5 -6
Silencers
SSL Pa -6 -10 -13 -18 -22
•Soft bag lters, FTF Pa -6 -9 -12 -16 -21
Closed ow plenum PMC Pa 0 0 0 0 0
Flow plenum with circular vents PMM Pa 0 0 0 -1 -1
Flow damper SAP Pa 0 0 -1 -1 -1
Flow grid GMD Pa -1 -2 -3 -4 -5
X Version (without coil)
Pa 10 15 21 29 37
H Maximum speed; M Average speed; L Minimum speed
Air ow rate
(m
3
/h)
Useful static pressure (Pa)
0
50
100
150
200
250
300
350
400
450
500
350 400 4 50 500 550 600 650 700 750 800
L
M
H