21
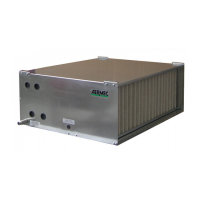
FILTERS PRESSURE DROPS
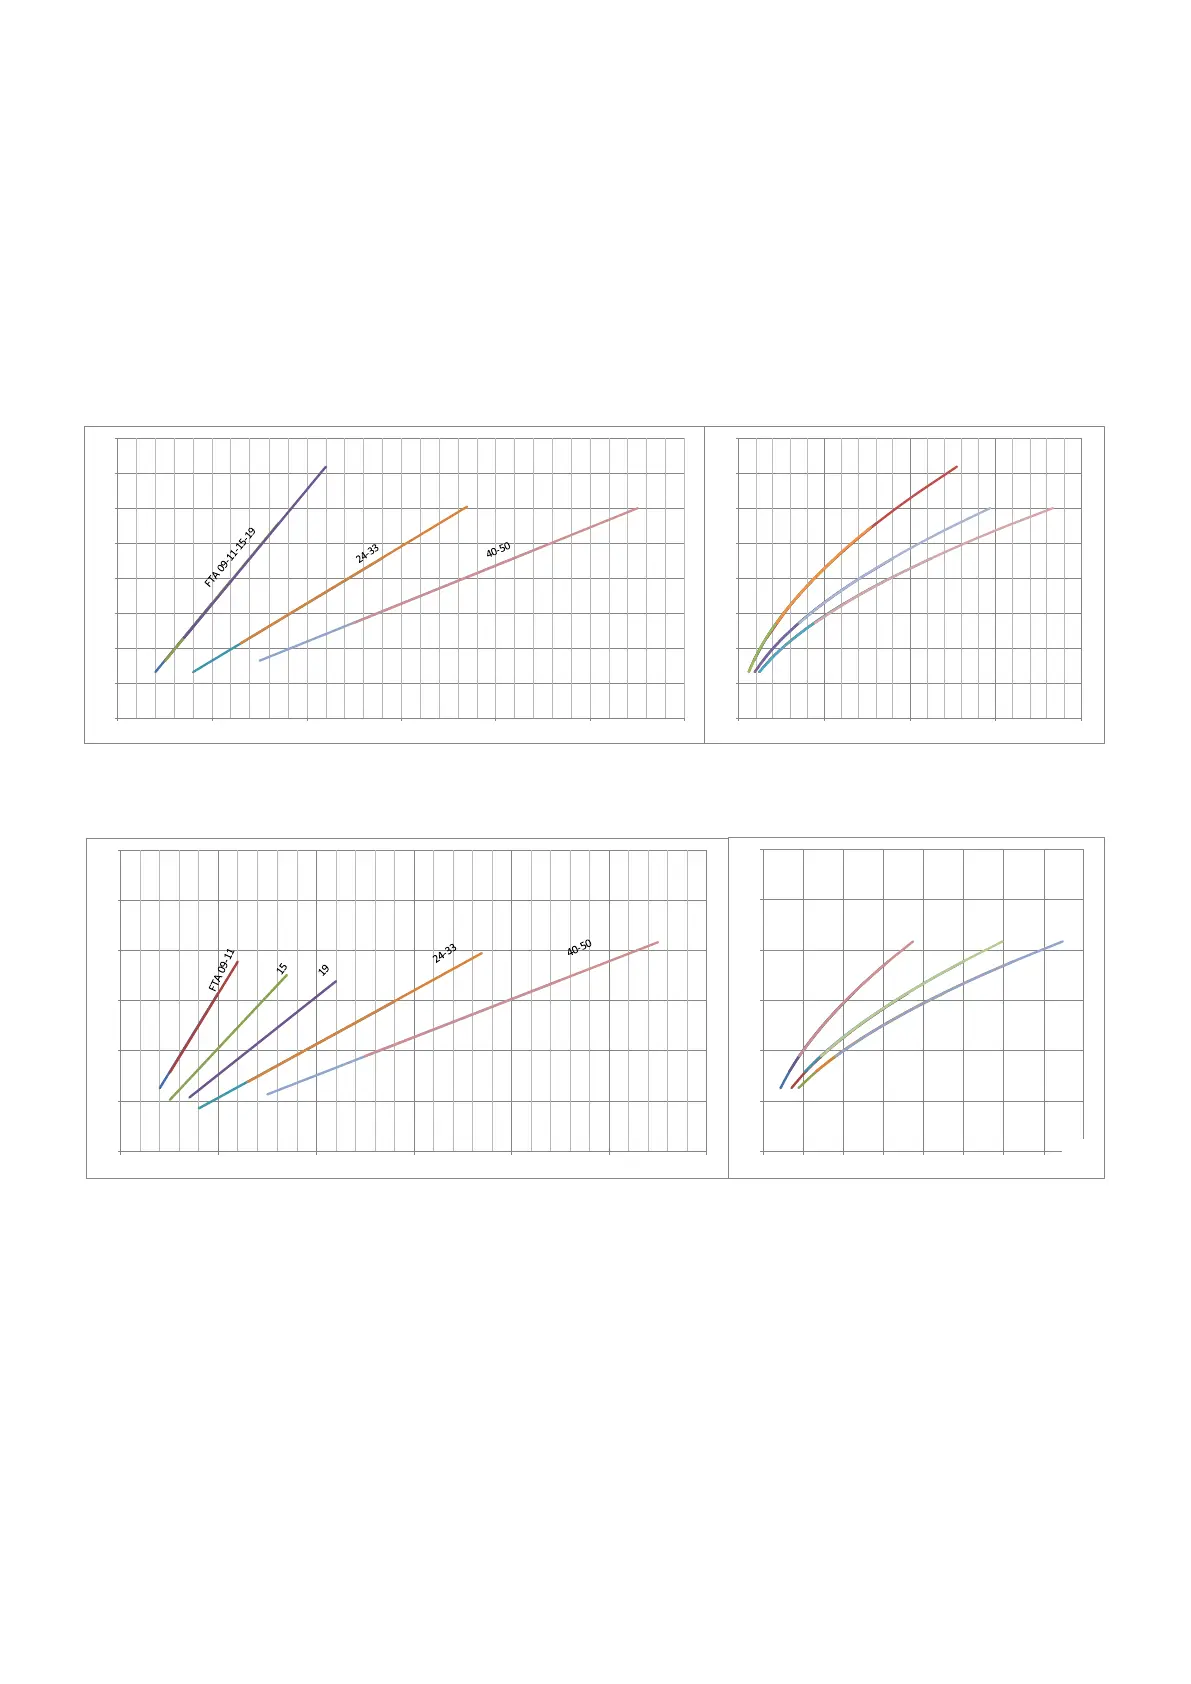
The following charts determine the pressure drops of the lters with dierent levels of fouling. From the chart on the left, bearing the air ow
rate (m³/h) in the axis of abscissae, move up from the concerned ow rate until you intersect the straight line corresponding to the unit size. At
this point, tracing a straight line parallel to the axis of abscissae intersect one of the three curves shown on the right chart each representing
the clogging degree of the lter as follows:
curve 1: lter clean
curve 2: lter clogged at 25%
curve 3: lter clogged at 50%
To determine the value corresponding to the lter pressure drop, trace a straight line until the axis of abscissae.
PRESSURE DROP OF FLAT FILTERS DUE TO FOULING:
PRESSURE DROP OF BAG FILTERS DUE TO FOULING:
0,00
0,50
1,00
1,50
2,00
2,50
3,00
3,50
4,00
0 1000 2000 3000 4000 5000 6000
0,00
0,50
1,00
1,50
2,00
2,50
3,00
3,50
4,00
0,0 50,0 100,0 150,0 200,0
1
2
3
0,00
0,50
1,00
1,50
2,00
2,50
3,00
0,0 10,0 20,0 30,0 40,0 50,0 60,0 70,0 80,0
Pa
1
2
3
0,00
0,50
1,00
1,50
2,00
2,50
3,00
0 1000 2000 3000 4000 5000 6000