18
www.agilent.com/find/esg
The incremental delay step at which BER tests are performed is set in the step size field.
The resolution of this field is also directly coupled to the oversampling ratio setting as
described previously. The Repeat field is used to set the number of BER test iterations for
each clock/gate delay increment. When this field is set to two or greater, the BER results
are plotted on the graph for each iteration of the measurement. By increasing the number
of BER test repetitions, it can easily be determined if repeatable results are achievable.
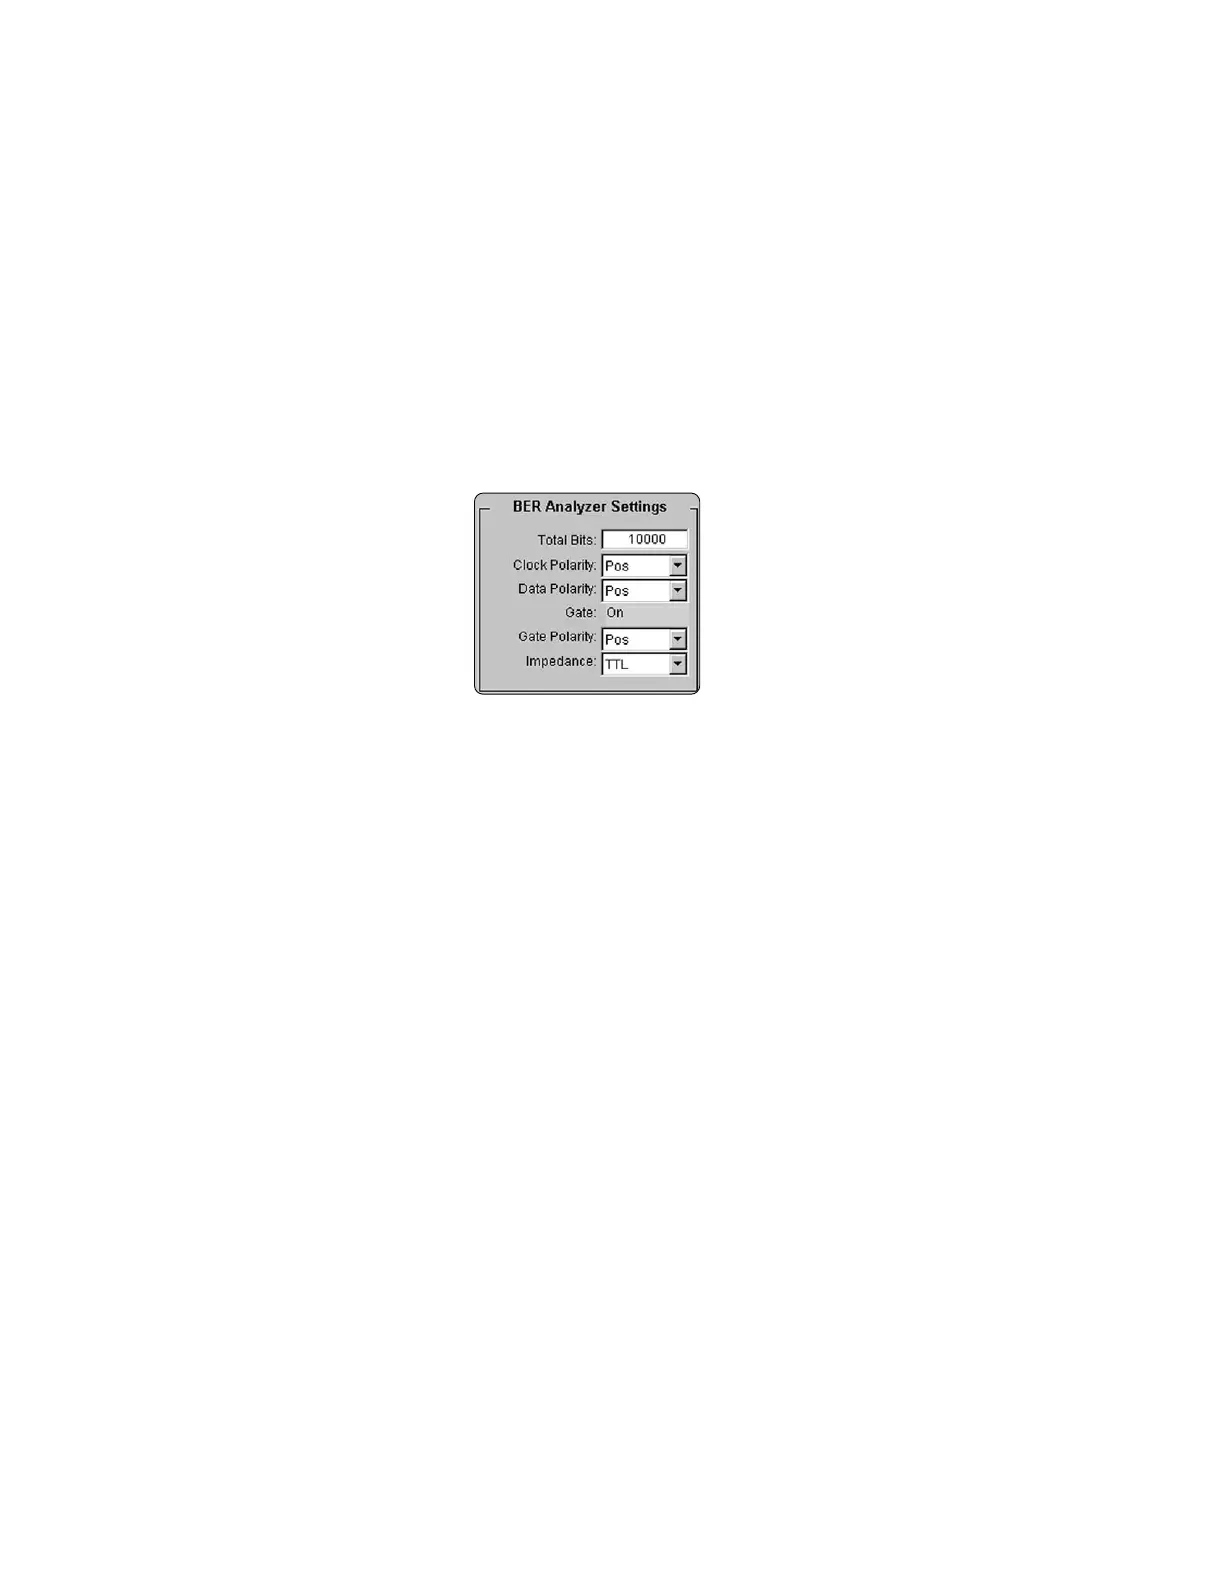
The ESG internal BER analyzer settings required to perform the clock/gate delay
calibration are also configured remotely using the Signal Studio software, Figure 22. The
total number of data bits to be analyzed at each delay increment is set in the total bits
field. The gate signal is automatically enabled in packet generator mode and disabled
in data stream mode. The default polarity of the clock, data, and gate signals is set to
positive. This is the correct setting for the basic measurement setup and should not be
modified unless there is a need to do so in a particular application.
Figure 22. ESG internal BER Analyzer setup menu.
Once configured, initiate the BER test sequence by pressing the Start button. A plot of
BER vs. clock/gate delay will be incrementally filled in as each BER test in the sweep
is completed. With no impairments added to the signal, a delay that results in 0 % BER
should be achievable.
After the plot has been generated, a marker is automatically placed at the clock/gate
delay setting with the minimum BER test results. The results section directly below
the graph is updated to reflect the marker position. The arrow buttons can be used to
incrementally move the marker to other points on the curve. The clock/gate delay setting
and corresponding BER are continuously updated in the results section as the marker
is moved across the graph. If the Repeat field is set to 2 or greater, the minimum,
maximum, and average BER is provided in the results section for each clock/gate delay
increment.
An example plot is provided in Figure 23. In this case, the repetitions field was set to
three. The dots indicate the individual results for each clock/gate delay increment
(note that some results overlap). The triangles are placed at the average BER for each
clock/gate delay increment.
Creating Signals
 Loading...