3-32 Service Guide E8364-90026
Tests and Adjustments PNA Series Microwave Network Analyzers
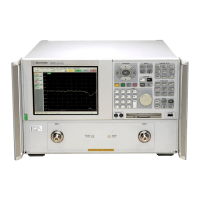
Performance Tests (Agilent N7840A Software Package) E8362B, E8363B, E8364B
Source Maximum Power Output Test
Function of the Test: To confirm the maximum source output power of your network
analyzer over its full frequency range.
Specification Tested: Test Port Output–Maximum Leveled Power
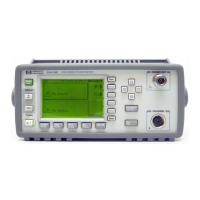
Equipment Used: A power meter, power sensors, and adapters.
Description of the Test:
1. A power sensor is connected to Port 1.
2. The analyzer’s output is set to hundreds of CW frequencies and, at each frequency, the
output power is increased until an “UNLEVELED” error is detected.
3. The power level at this point is measured and compared to the maximum output power
specification.
If the Analyzer Fails this Test:
•Go to “Checking the Signal through the Signal Separation Path” on page 4-49 for
troubleshooting information to determine the faulty assembly.
Source Power Linearity Test
Function of the Test: To verify that the power level is linear over the analyzer’s
frequency range and to check the linearity of the automatic leveling control (ALC).
Specification Tested: Power Sweep Range and Power Level Linearity
Equipment Used: A test cable. (And a 20 dB pad if the analyzer does not have an internal
step attenuator.)
Description of the Test:
1. The Port 2 receiver is used to test Port 1. The receiver linearity is the standard against
which the source linearity is checked.
2. A test cable is connected between Port 1 and Port 2 with 20 dB of attenuation in series
with the cable. This can be done with an internal step attenuator or an external 20 dB
pad. This attenuation ensures that the receiver remains in its linear range.
3. The analyzer is set to 25 different points across its frequency range.
4. At each frequency point, the output power level on Port 2 is set to 0.000 dBm and the
power is measured to establish a reference, P
reference
.
5. The source setting is then stepped from −15 to +10 dBm in 1 dB steps and the power is
measured, P
measured
, at each setting.
6. The non-linearity in dB at each frequency point is calculated as:
(P
measured
− P
reference
) − (source setting)
If the Analyzer Fails this Test:
•Perform the “Source Calibration Adjustment” on page 3-47 and repeat this test.
• If the analyzer still fails this test, replace the source assembly and repeat this test.
Refer to “Removing and Replacing the A12 Source 20” on page 7-22.

 Loading...


