WebServer application
GasEye Cross Duct
143
Measurement tab
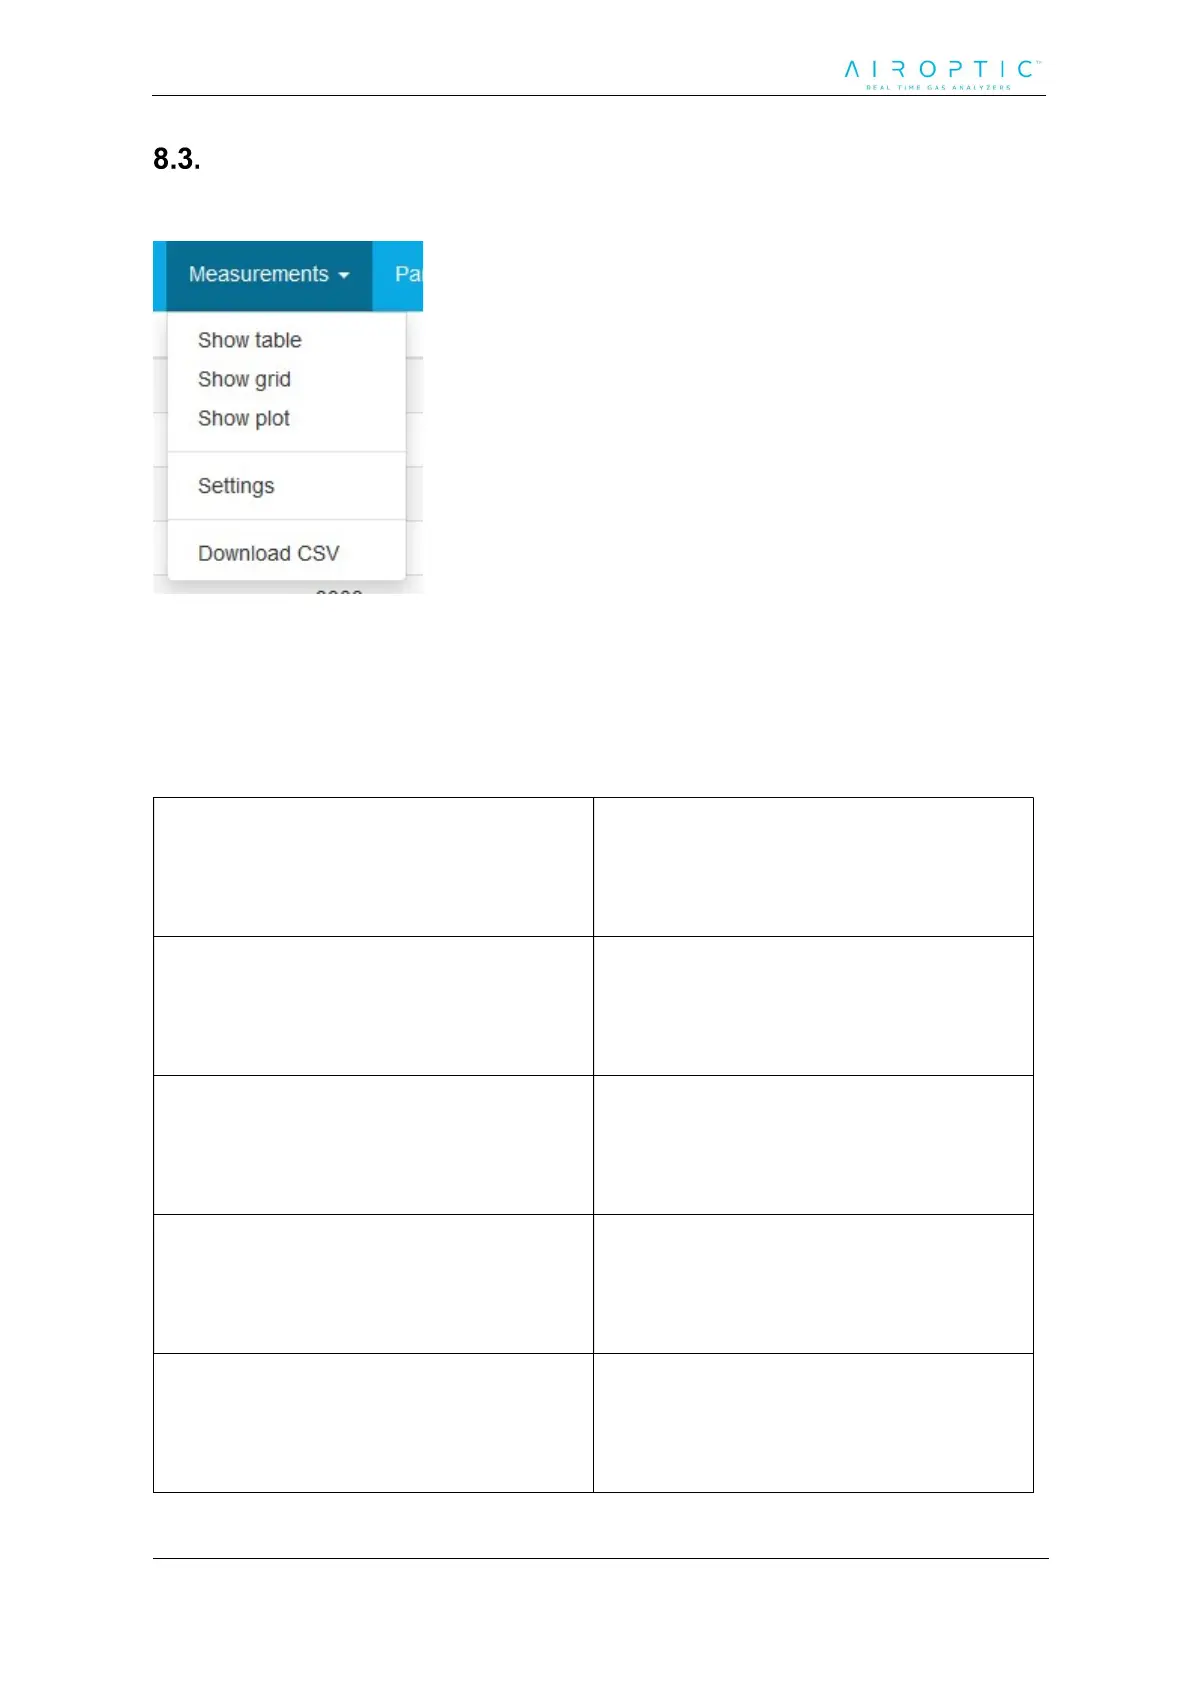
Drop-down menu will appear when clicking on the Measurements.
Figure 139. Webserver application - Measurement tab.
In the Measurement tab there are five functionalities that are accessible by clicking
the respective field.
Table 14. Measurement window functionalities.
Show table
Shows table with the variables acquired
from the instrument. User can choose
which one are plotted by ticking a box
next to the demanded variable
Show grid
Shows grid with the measurements.
Their visibility is not affected by user
choice in the table.
Show plot
Activates plot of the variables chosen
from the table.
Settings Opens measurement settings menu.
Download CSV
User may download measurements
chosen in the table and save it in a
comma-separated (*.csv) format.