Type in:
5 cls
10 plot 10,10
20 draw 10,390
30 draw 630,390
40 draw 630,10
50 draw 10,10
60 goto 10
run
Press [ESC] twice to break from this program.
Now add the following lines to the program, to draw a second rectangle inside the first. Type in:
60 plot 20,20
70 draw 20,380
80 draw 620,380
90 draw 620,20
100 draw 20,20
200 goto 10
run
Press [ESC] twice to break from this program.
CIRCLES
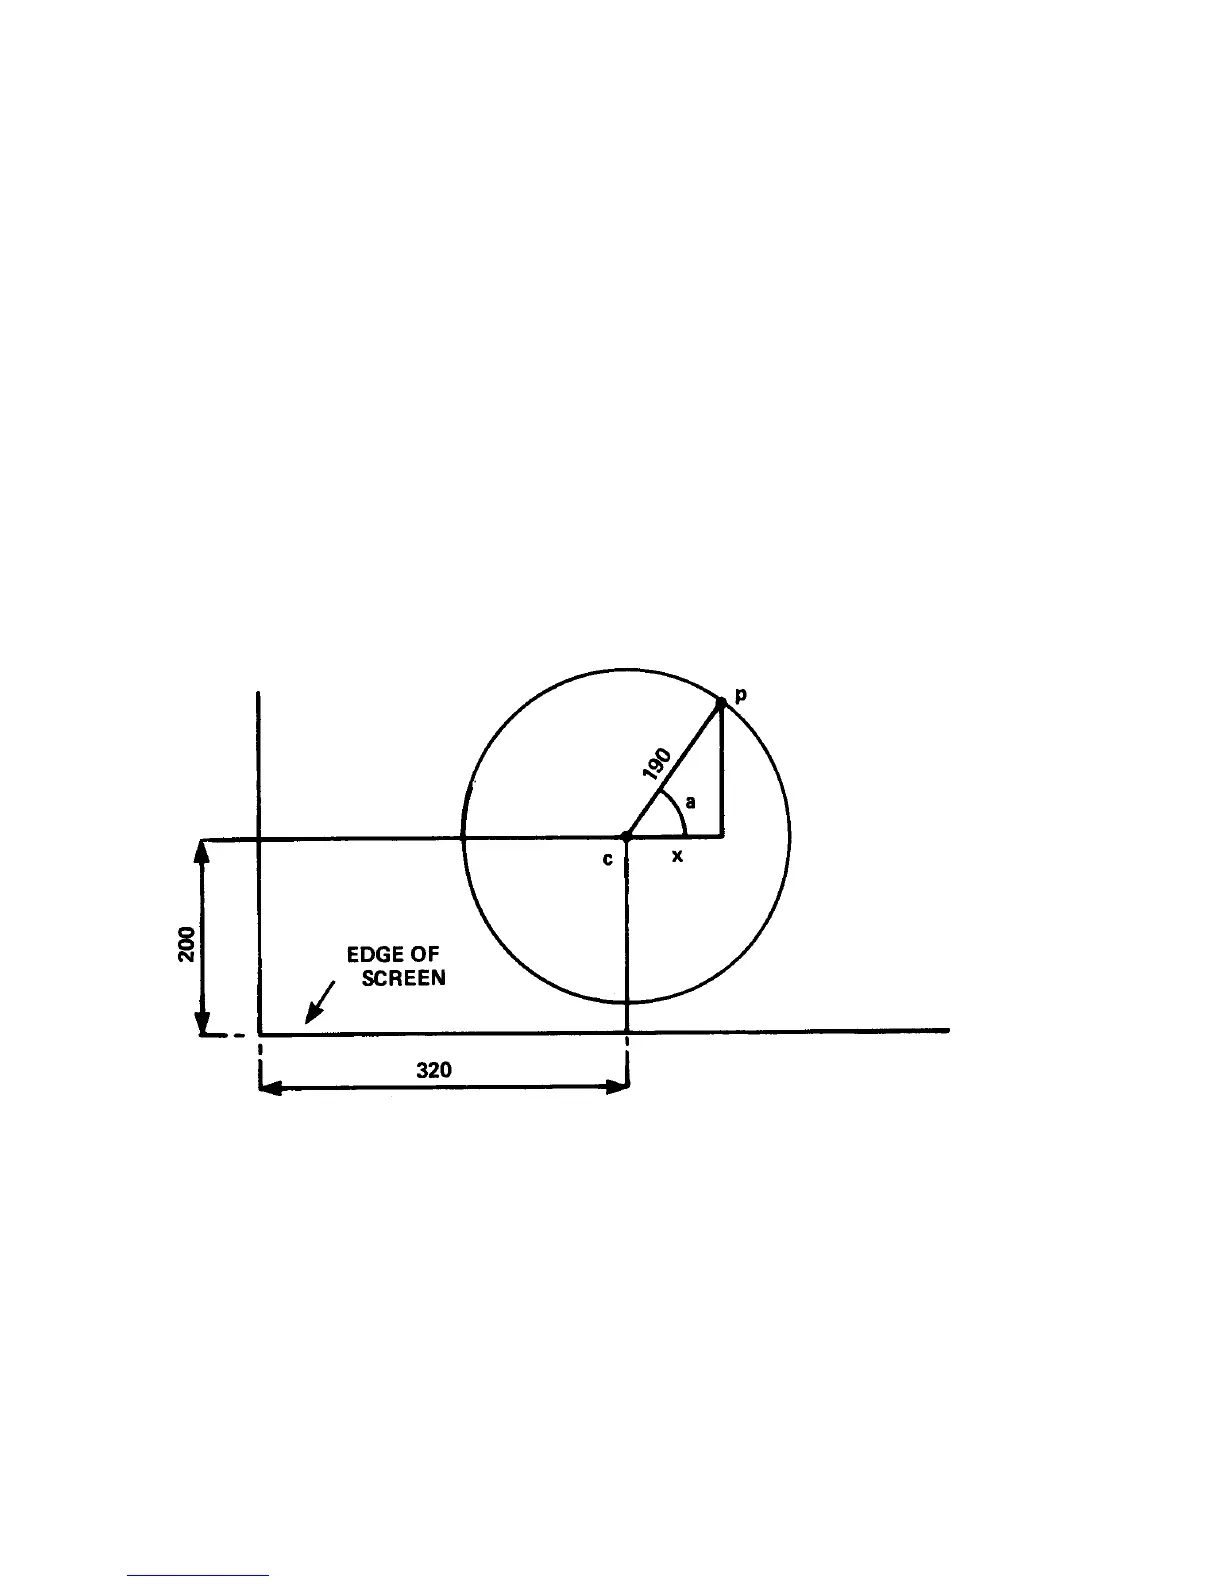
Circles can either be plotted or drawn. One method of forming a circle is to plot the x,y, co-ordinates
of each point on the circumference of a circle. Refer to the figure below and you will see that point p
on the circumference can be plotted using x and y co-ordinates. These are:
x=190*cos(a) and y=190*sin(a)