34 Bedrock SMxx operating manual © Bedrock Audio BV, 2019
35
7.3. Real-Time Analyzer (RTA)
The RTA module is intended for frequency analysis in the range from 20 Hz to 20 kHz.
The bandwidth of the frequency bands can be set to 1/1, 1/3, 1/6 or 1/12 octaves. We recom-
mend 1/1 or 1/3 octave analysis for most uses, unless a finer frequency resolution is needed.
The operation is generally similar to the SPL module, but instead of just the overall signal
level, a frequency analysis (into separate frequency bands according to IEC-61260:2014
class 1) is also shown.
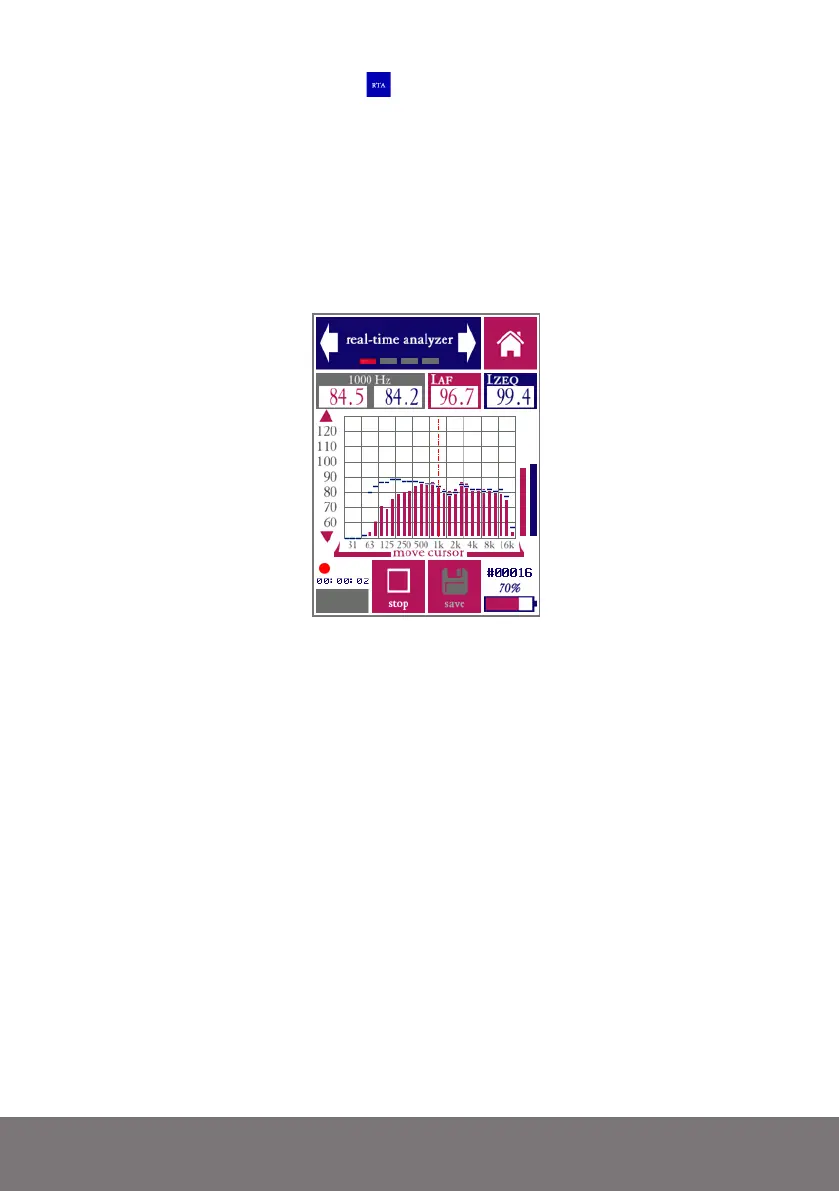
RTA main measurement screen (1/3 octave band mode)
The RTA module has the ability to present two different spectral views at the same time,
differing in frequency weighting (A, C or Z) and time averaging and integration (FAST,
SLOW, MAX, or EQ). The main spectrum is presented in red bars, while a second (auxil-
iary) spectrum is shown in blue lines. The corresponding broadband levels are also shown,
to the right of the spectrum.
While the spectrum graph already gives a first impression of the spectral content of the
measured signal, you may wish to read the exact value in each band. This is done by placing
the cursor (dashed line) over the band of interest. The cursor can be moved left and right
by pressing on the left or right side of the frequency axis (or the area of the graph above
the axis). The values for the selected band are shown in the grey field on the top left of the
screen (main weighting shown in read, aux weighting in blue - same color as the spectrum
bars).
The “measuring time” screen can be used to set the duration of a measurement to a fixed
value. The measurement can also be set to run until stopped manually. The “settings”
screen allows you to switch frequency resolution, and to change the weightings for the
main and auxiliary spectrum views.