M A I N T E N A N C E P R A C T I C E S
Wa v e f orm s a n d R M S Voltag e Ta b l e s 10 4 a n d 105
(b)
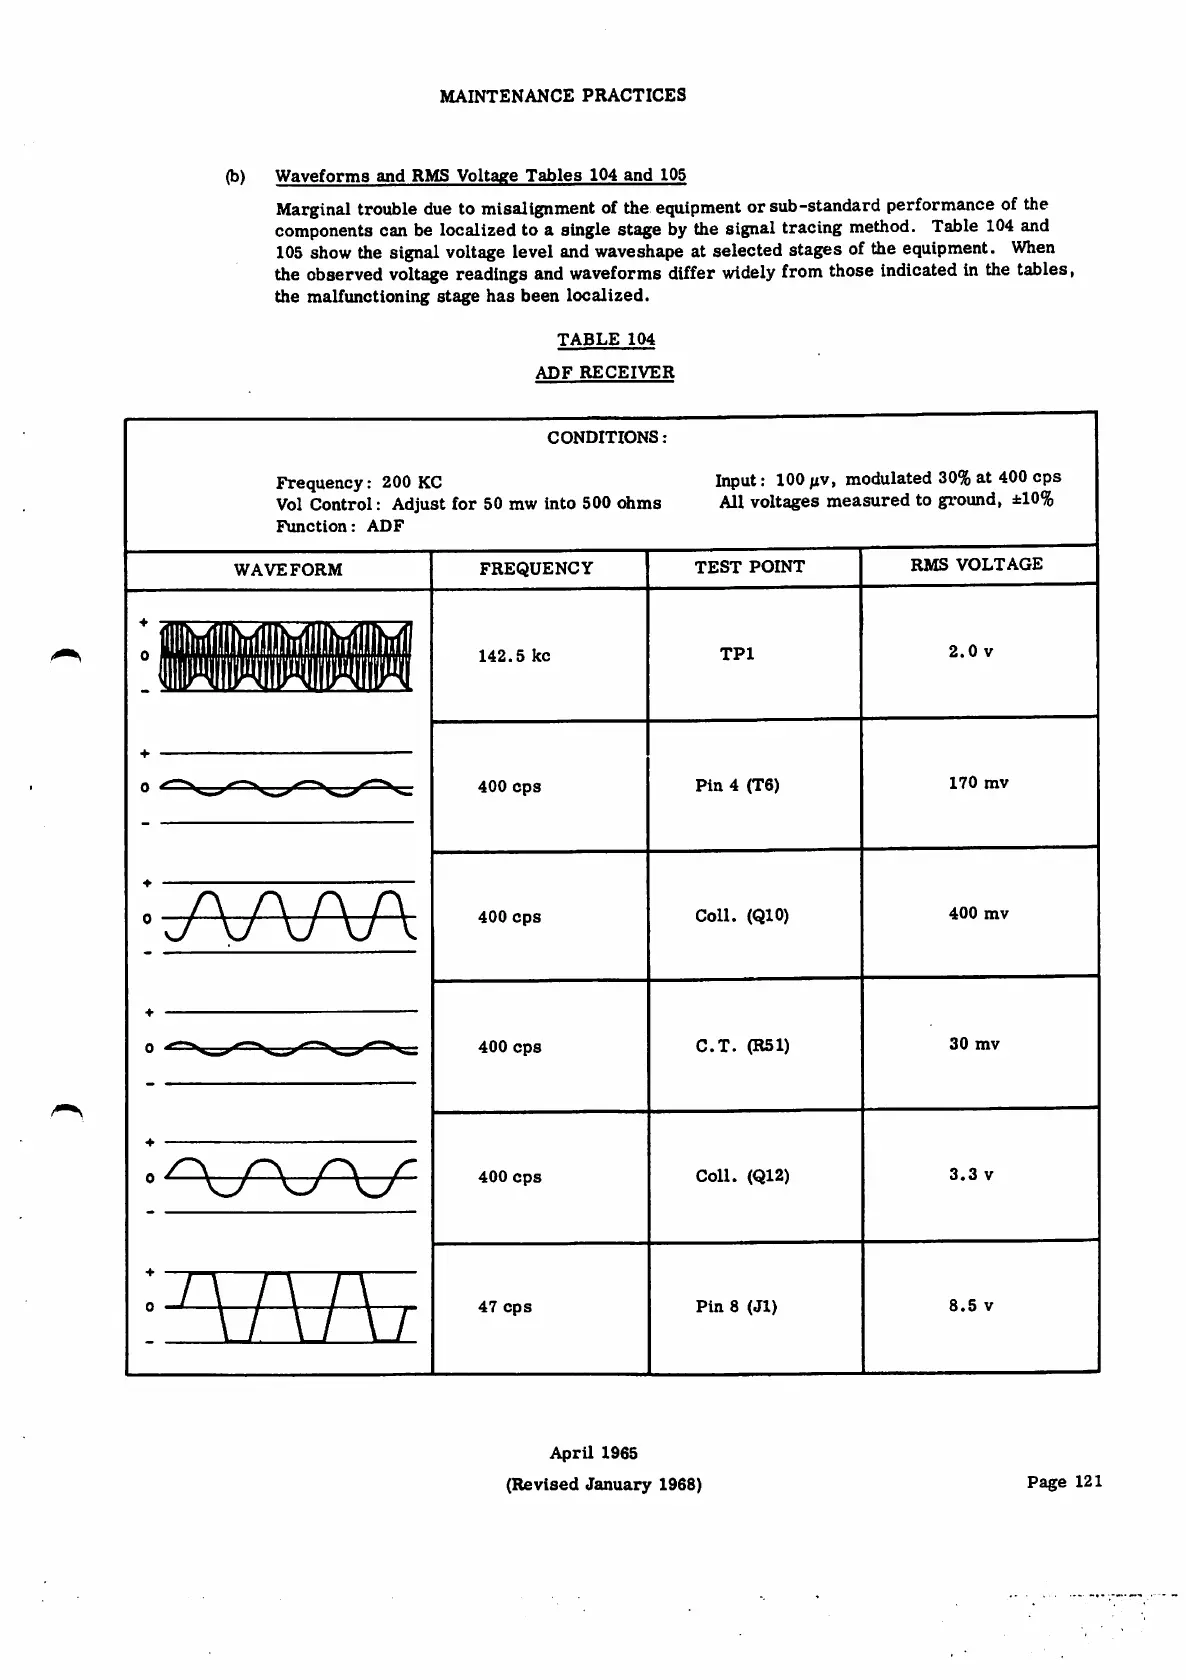
Marginal trouble due to misalignment of the equipment or sub-standard performance of the
components can be localized to asingle stage by the signal tracing method.
105 show the signal voltage level and waveshape at selected stages of the equipment. When
the observed voltage readings and waveforms differ widely from those indicated in the tables,
the malfunctioning stage has been localized.
Tab l e 1 0 4 an d
T A B L E 1 0 4
ADF RECEIVER
C O N D I T I O N S ;
Input: 100 pv, modulated 30% at 400 cps
All voltages measured to gi-ound, ±10%
Frequency: 200 KC
Vol Control: Adjust for 50 mw into 500 ohms
Function: ADF
R M S V O L T A G E
TEST POINT
FREQUENCY
WAVEFORM
2.0 V
TPl
142.5 kc
170 mv
Pin 4(T6)
400 cps
0
°ywv\
400 mv
Coll. (QIO)
400 cps
30 mv
C.T. (R51)
400 cps
0
+
3.3 V
Coll. (Q12)
400 cps
0
Pin 8(Jl)
8.5 V
47 cps
I
April 1965
(R e v i se d J a n u a r y 1 9 6 8)
Page 121