Page 11
FREQUENCY ANALYSIS
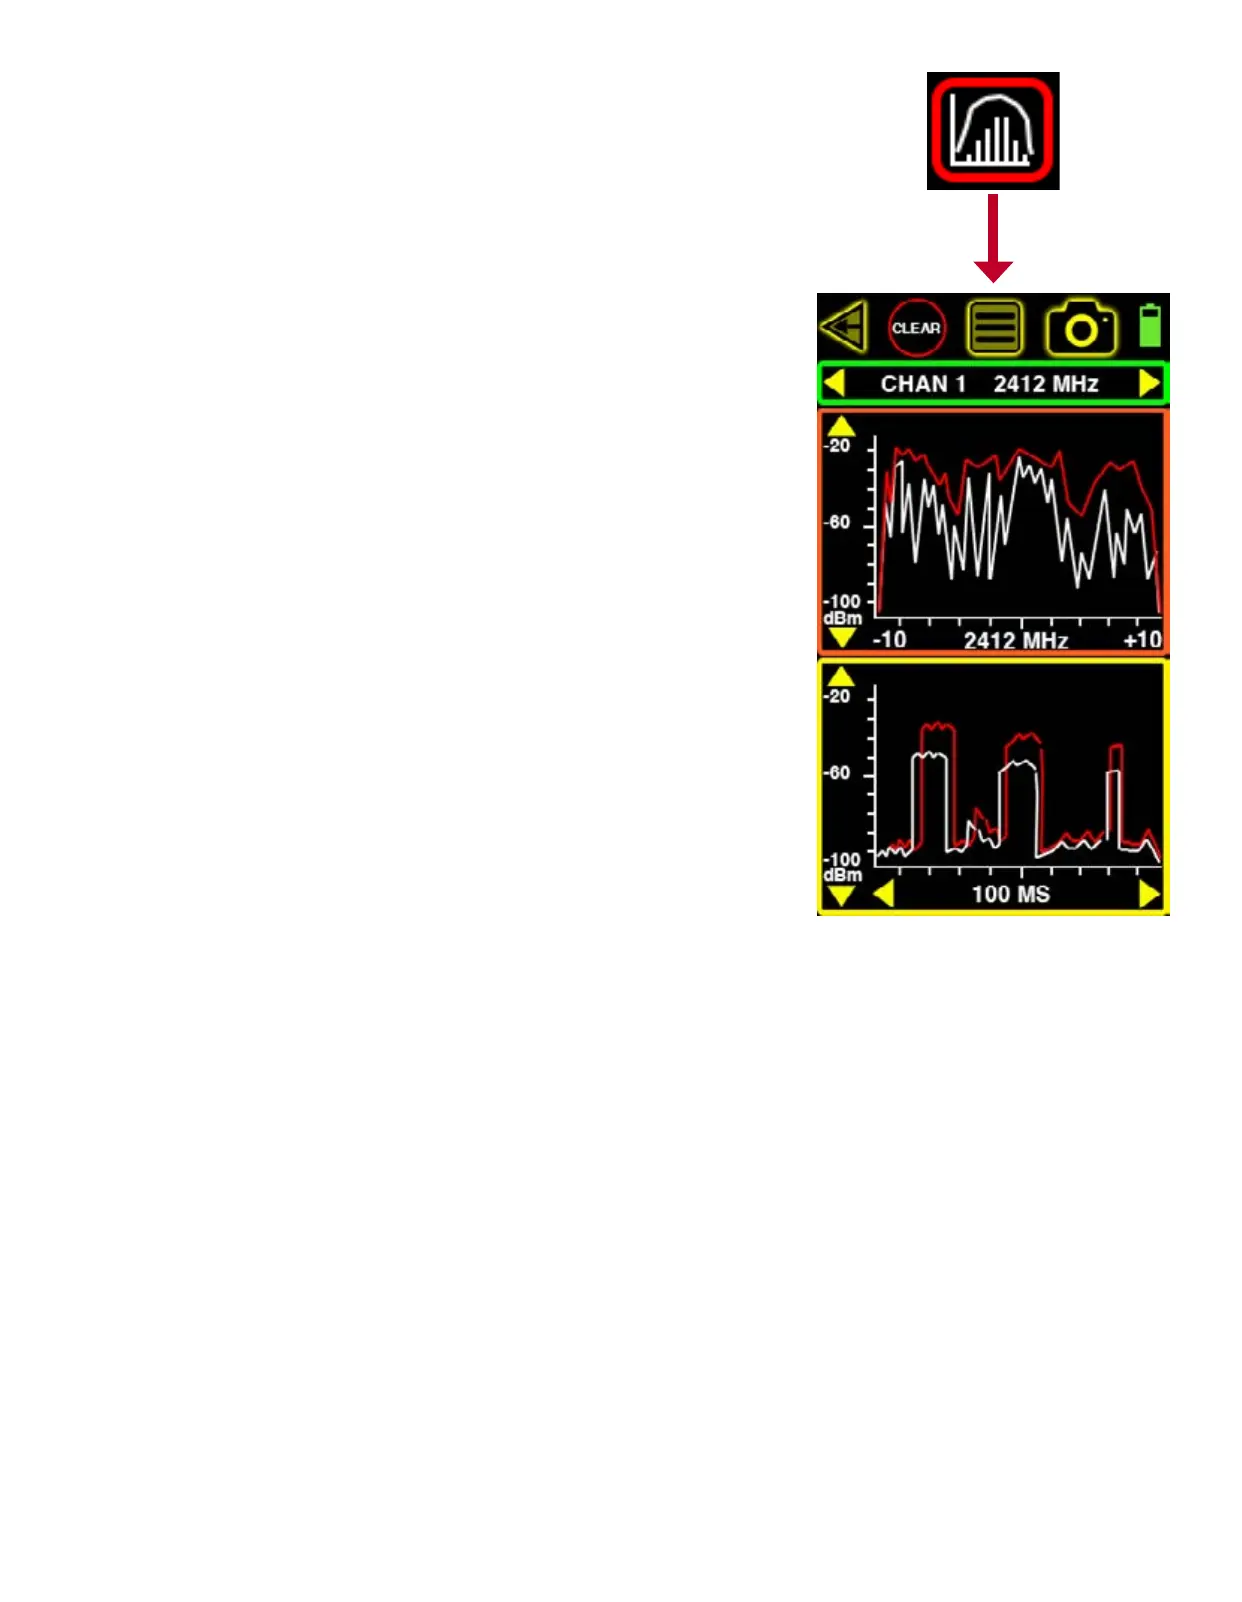
The FREQUENCY ANALYSIS screen can only be accessed from the MAIN MEASURMENT screen. It
consists of 2 different panels that both scan the 2.4 GHz spectrum but do not display live data
simultaneously. The orange panel on top is a frequency domain that scans 20 MHz chunks start-
ing at the center of each of the (14) 802.11b/g channels. The yellow panel on the bottom is a
time domain that samples a single frequency (same as center frequency in the top panel) over
a selectable time interval.
Touch the top panel to begin scanning by frequency. If the time domain panel below was active,
it will freeze during the frequency domain scan. Move along the spectrum in 20 MHz chunks by
touching the left or right yellow arrows on the green top panel. Adjust the dBm scale by touching
the up and down yellow arrows on the left side of the orange top panel just below.
Touch the bottom yellow panel to activate the time domain scan. If the frequency domain panel
above was active, it will freeze during the time domain scan. Move along the spectrum in 20
MHz chunks by touching the left or right yellow arrows on the green top panel. Adjust the dBm
scale by touching the up and down yellow arrows on the left side of the yellow bottom panel.
Choose between 100 ms, 1 sec and 10 sec using the yellow left and right arrows at the bottom
of this yellow panel.
The white lines indicate realtime activity in each panel and the red lines indicate peak activity
in each panel. Touch the CLEAR button at any time on the top to reset the red peak activity lines.
Each graph has its merits but the biggest value to most users is in capturing both domains’
signals and analyzing them together in order to recognize the combined pattern belonging to a
specic signal source.