Page 6
CELLULAR MEASUREMENTS
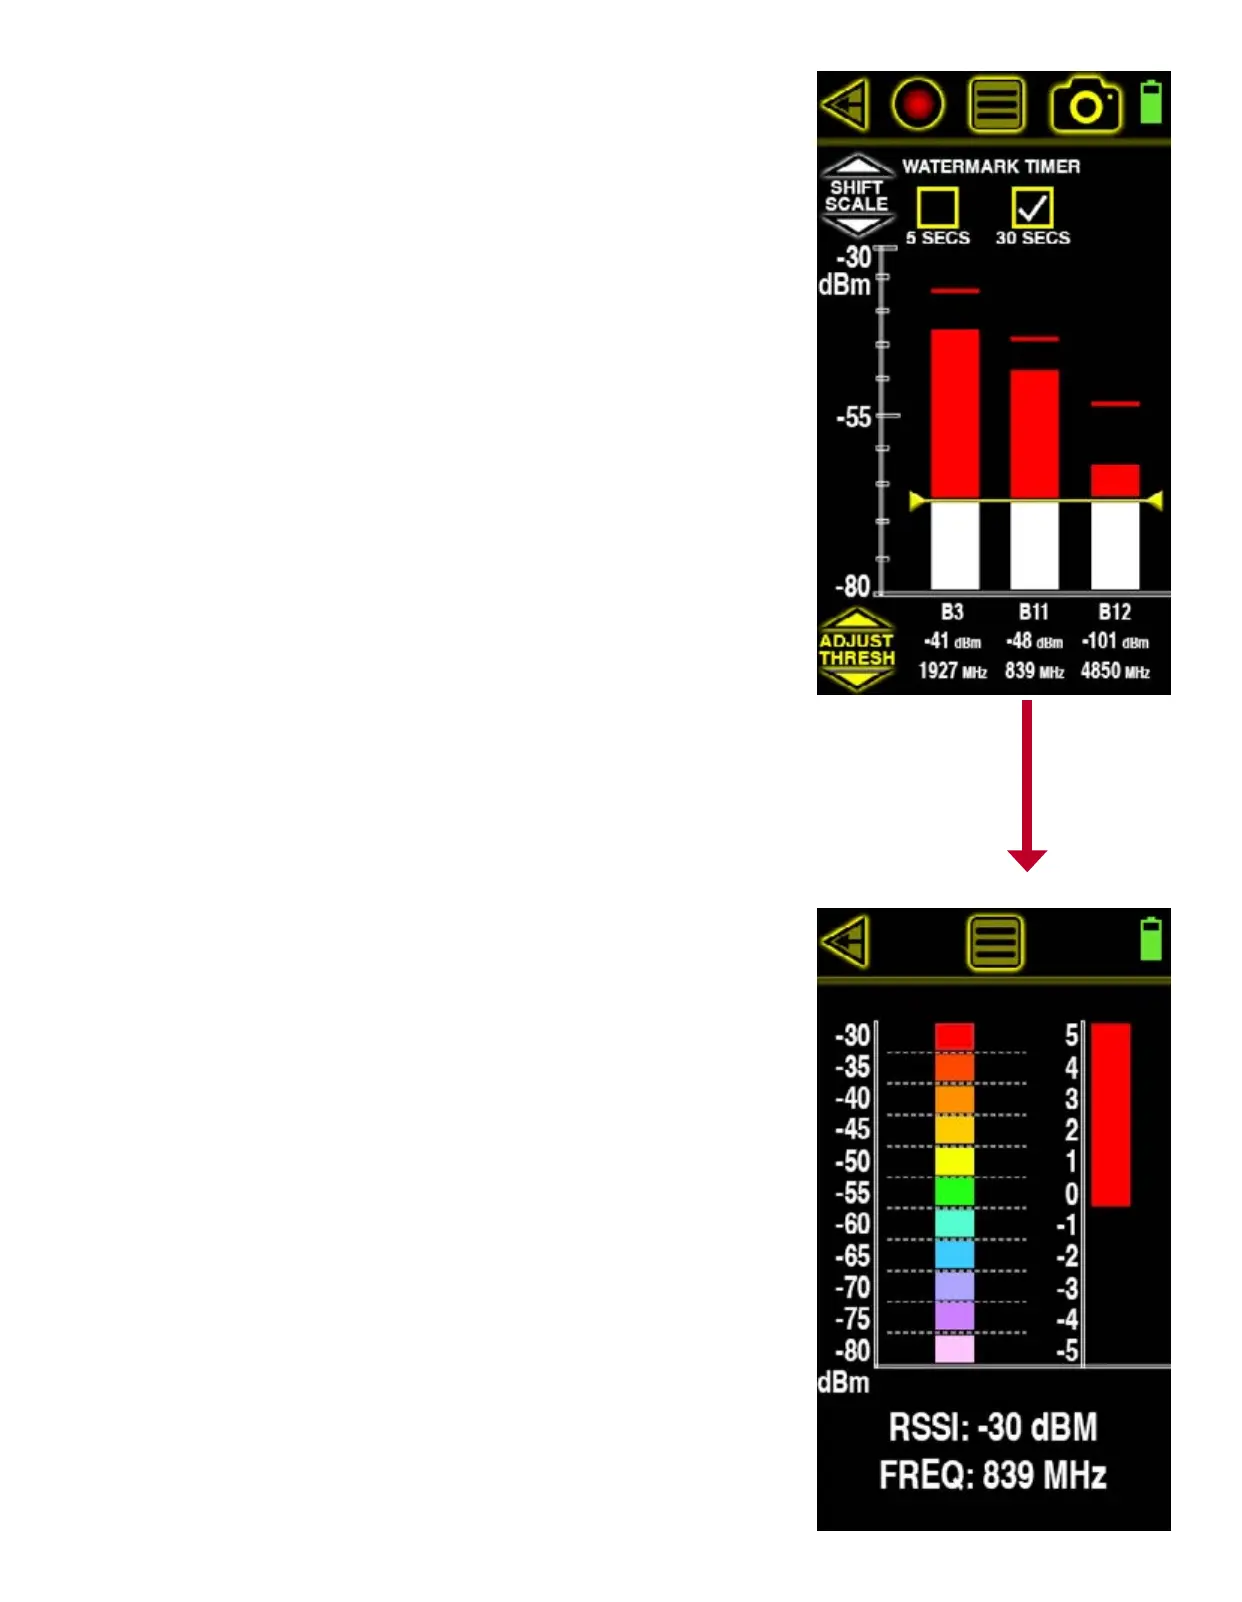
This screen displays the 3 highest cellular signal strength measurements in dBm, frequency and
cellular channel allocation from moment to moment. This means that the top 3 strongest signals
displayed can quickly change if any newer, stronger cellular signals are then detected. This al-
lows users to dynamically sweep the area for the strongest (usually the closest too) signals in
real time.
Choose SHIFT SCALE to dynamically shift the dBm measurement scale between 0 dBm to -50 dBm
and -40 dBm to -90 dBm. SCALE SHIFT allows users to effectively “zoom in” or “zoom out” on
signals that are too visibly low or too high respectively.
The threshold is also adjustable allowing for vibrating alerts when any one or all of the signals
break that threshold. When a vertical signal strength measurement bar is greater than the
threshold setting, the area above the threshold turns red. Touch the up or down ADJUST THRESH
arrows to adjust the threshold. Lowering the threshold (touching down arrow) is useful for de-
tecting and alerting users to lower strength measurements. Raising the threshold (touching up
arrow) is useful for detecting and alerting users to higher strength measurements.
Each vertical signal strength bar displays a high watermark indicating the maximum signal
strength detected. This peak signal strength can indicate a great change in signal strength over
time that cannot be seen by simply looking at this screen momentarily. The watermark timer is
settings are located at the top of the screen and can reset the watermark every 5 or 30 seconds
automatically.
Users who wish to pick a single measurement for further surveying and direction nding can
simply touch the one of interest to enter the CELLULAR DIRECTION FINDING screen.
CELLULAR DIRECTION FINDING
This screen allows users to locate a cellular device being measured by replacing the standard
omni-directional antenna with the optional direction nding antenna and using the real time
signal strength scales. The color-coded scale on the left is measured in a range from -30 dBm
to -80 dBm. Each colored bar represent 5 dBm. The stronger the signal, the greater the number
of bars that are shown. Before you begin direction nding, replace the small omni-directional
antenna with the larger directional at the middle SMA antenna connection (650 MHz - 3000
MHz) on top of the Yorkie-Pro unit.
As you sweep, the colored bar will guide you in the direction of the cellular signal source by
lowering and raising accordingly. When the colored bars are at their maximum height, you can
utilize the scale to the right to view further signal strength details in dBm. The top half of this
scale (starting at 0 and ending in 5) corresponds to 5 dBm which is also the size of a single
colored block on the left so the scale on the right effectively magnies the top portion of the
scale on the left.