Page 3
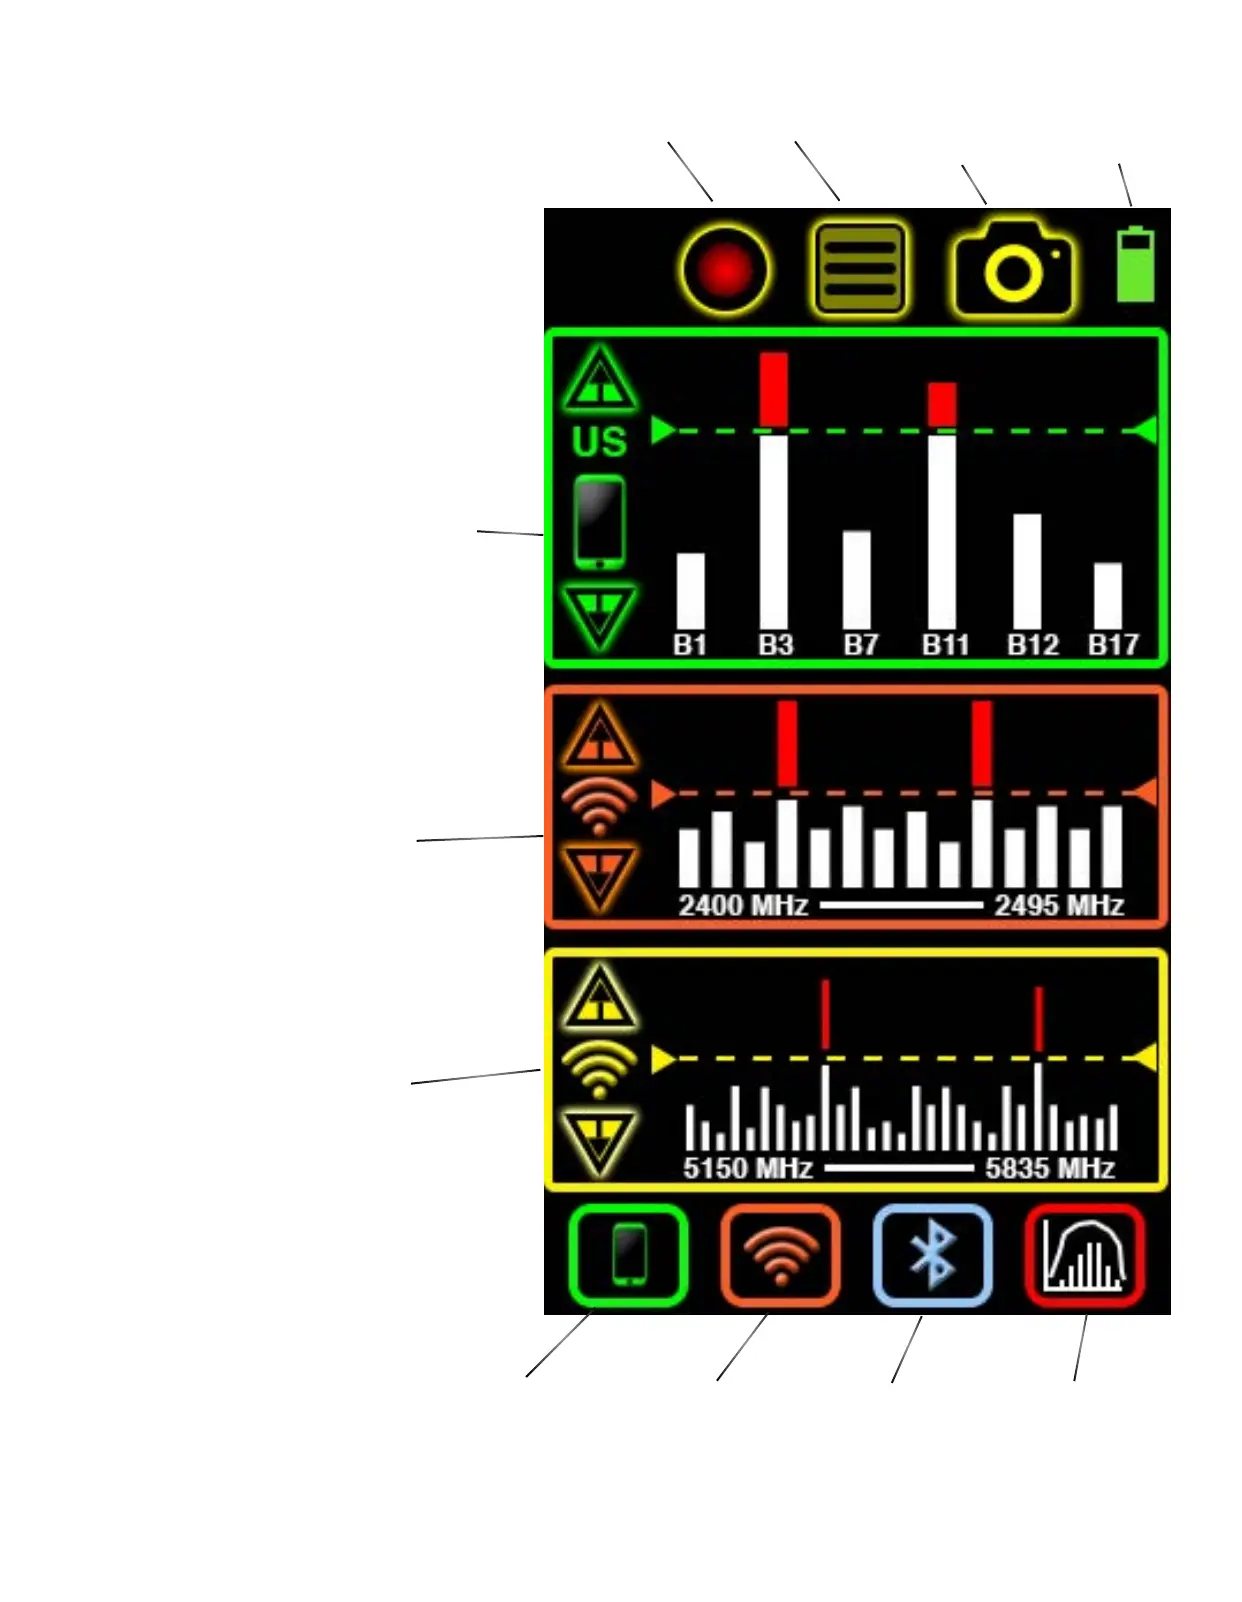
Records all data shown
on screen for export
and review onto PC
Navigates to
Main Menu for
all settings.
Saves a single data
snapshot and time-
stamps for export
and review onto PC.
Battery level indica-
tor. Navigate to bat-
tery settings in main
menu for more info.
Top 6 strongest cellular frequencies are listed by channel
number. Use UP/DOWN arrows to adjust threshold. Red signal
strength bars indicate level above threshold and will trigger
vibrating alerts depending upon alert settings. ‘US’ indicates
United States cellular bands will only be detected. Yorkie-Pro
ships from the factory with country’s RF bands as indiacted
by the customer but you can change to your country of choice
in the Main Menu settings. Please consult with BVS sales or
support staff to verify that your unit can support your country
before purchasing and also before you attempt to change the
country in the MAIN MENU.
Displays entire 2.4 GHz Wi-Fi 14 channel band. Use
UP/DOWN arrows to adjust threshold. Red signal
strength bars indicate level above threshold and will
trigger vibrating alerts depending upon alert settings.
Displays entire 5 GHz Wi-Fi band. Use UP/DOWN ar-
rows to adjust threshold. Red signal strength bars in-
dicate level above threshold and will trigger vibrating
alerts depending upon alert settings.
Push this button
to access cel-
lular band and
compare top 3
strongest signals
received.
Push this button to access
a list of all Wi-Fi access
points by signal strength
and more information.
Push this button to access a
list of all Bluetooth and BLE
(Bluetooth Low Energy) ac-
cess points by signal strength
and more information.
Push this button to
access the frequency
analyzer screen which
displays frequency and
time domain graphs in
2.4 GHz band only.
MAIN MEASUREMENT
This is the rst and main Yorkie-Pro measurement
screen users will see allowing a quick glance of all
wireless activity. In this screen, independent thresh-
olds can be set for cellular and Wi-Fi bands. Users can
also drill down to one or all lists of all detected de-
vices. Logging data, data snapshots and main menus
can all be accessed from here too. A frequency and
time domain analysis screen can only be accessed
from here.