Theory of Operation Section 4
4-9
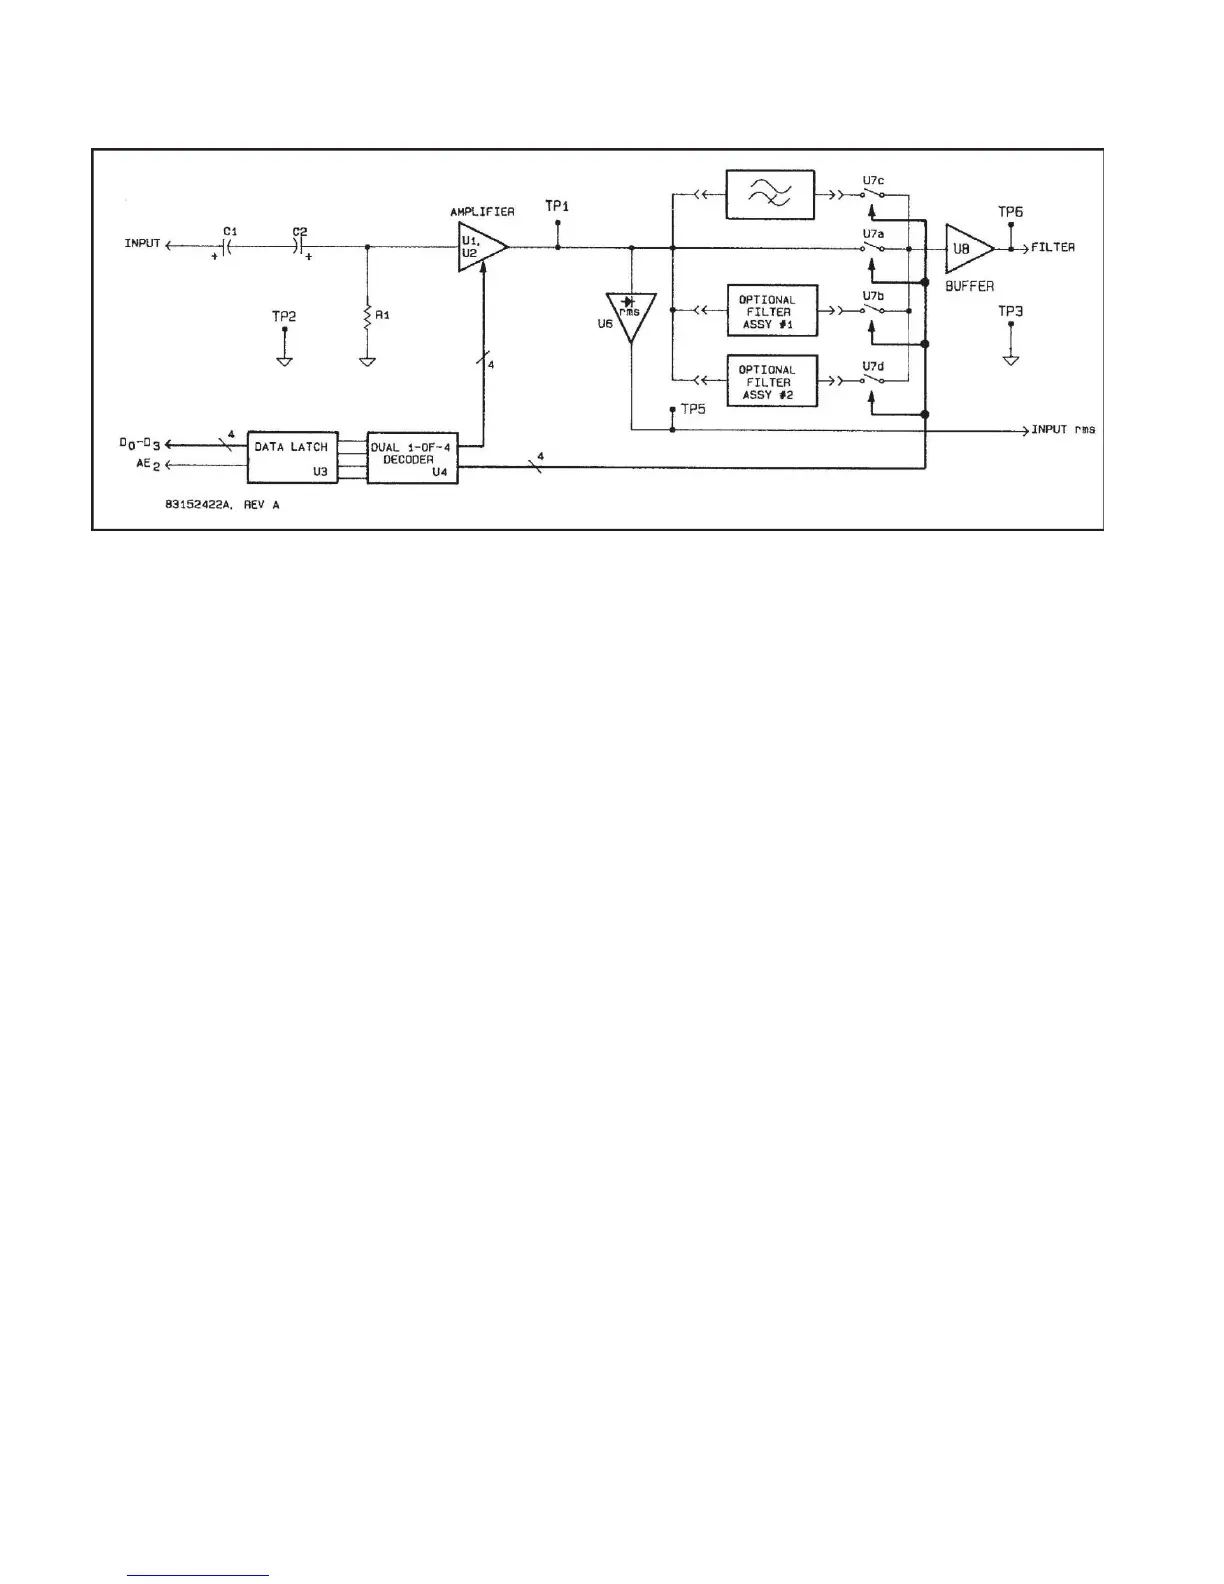
Figure 4-6. Filter Circuits Block Diagram.
4-46. A 40 dB attenuator is formed by resistors R3
through R7, R15, and R16. This attenuator is engaged by
relays K6 and K7 for level ranges above 30 volts. High
frequency compensation is provided by C6 through C9
and C30 thorugh C33. Common mode adjustment R7
adjusts the attenuation balance between the high and low
inputs when the attenuator is engaged. Relays K6 and K7
are energized through transistor Q5 by data latched in U1
from the CPU circuits.
4-47. A 20 dB attenuator is formed by resistors R8
through R11, R15, and R16. This attenuator is engaged
by relays K8 and K9 for level ranges between 3 and 30
volts. High frequency compensation is provided by C5,
C10, C13, C14, C21, and C22. Common mode adjust-
ment R12 adjusts the attenuation balance between the
high and low inputs when the attenuator is engaged.
Relays K8 and K9 are energized through transistor Q6 by
data latched in U1 from the CPU circuits. Over voltage
protection is provided by clamping diodes CR7 through
CR10 and R13 and R14 (TP1, TP2).
4-48. In the DC level mode, buffers U7a and U7b are
switched in the signal path by analog switch U4. U7a and
b are low DC offset devices which are necessary for DC
level measurement accuracy. Analog switch U4 is wired
in a DPDT form and is controlled by data latch, U2, which
also energizes K4 and K5. Instrumentation amplifier
consisting of U5, U8, U9, and associated components
provide programmable gains of X1, X2, X4, and X6. Gain
setting resistors R17 through R22 are configured by K1
and K2 for gain selections. Relays K1 and K2 are
energized through Q1 and Q2 and resistors R43 and R44
by data latched in U2. High frequency compensation is
provided by C3, C4, C25, C28 and C29. Amplifier U9 and
resistors R25 through R29 from the differential to
single-ended converter stage of the instrumentation
amplifier. R29 enables the adjustment of the common
mode rejection of the stage.
4-49. The common mode (TP4) and differential (TP6)
signals are separately monitored by window detectors
U6a through d for peak voltages exceeding ± 10 volts.
The common mode signal is formed by summing the
outputs of U5 and U8 with resistors R23 and R24 (TP4).
The ± 10 volt window is formed by CR11, CR12, and R26.
Any common mode or differential peak amplitude
exceeding ± 10 volts will cause the open-collector output
(TP5) of the detecting device to sink to -15 volts which is
applied through R30 and R34 to the latch clear inputs of
U1. Clearing latch U1 will engage the 40 dB attenuator
and remove the overrange condition. The state of the 40
dB attenuator is monitored by the CPU circuits thorugh
the overrange status line, OVR, connected to U1 pin 9.
4-50. In the DC level measurement mode the DC level
at the output of the instrumentation amplifier is filtered by
R31 and C18 and measured by one channel of the A/D
converter on the counter plug-in board.
4-51. A1 Filter Circuits. The output of the Input circuits is
further amplified by the filter plug-in board and the rms
value of the AC signal is detected. Up to two optional filter
modules can be installed on the filter board and inserted
into the signal path. Refer to Figure 4-6.
4-52. The signal from the input plug-in board is AC
coupled to programmable gain amplifier U1 through C1,
C2, and R1. Gain selections of X1, X2.5, X5, and X10 are
determined by R2, R3, R4 and R5 and are selected by
analog switch U2a, b, c and d. Gain selection data from
the CPU board is latched in U3. Dual one-of-four decoder
U4 decodes the data and enables one of the three gain
selections.
4-53. The output of the amplifier U1 (TP1) is applied to a
monolithic rms-to-DC converter, U6, which converts the
AC signal to a DC level representing the rms value of the


 To Next Page