Results:
Results:
items ({x
n
; freq
n
} = {1;1, 2;2, 3;3, 4;2, 5;1}), and calculate the mean and
population standard deviation.
(SETUP) (STAT) (ON)
(STAT) (1-VAR)
1 2 3 4 5
1 2 3 2
(STAT) (Var) (x) 3
(STAT) (Var) (σ
x
)
1.154700538
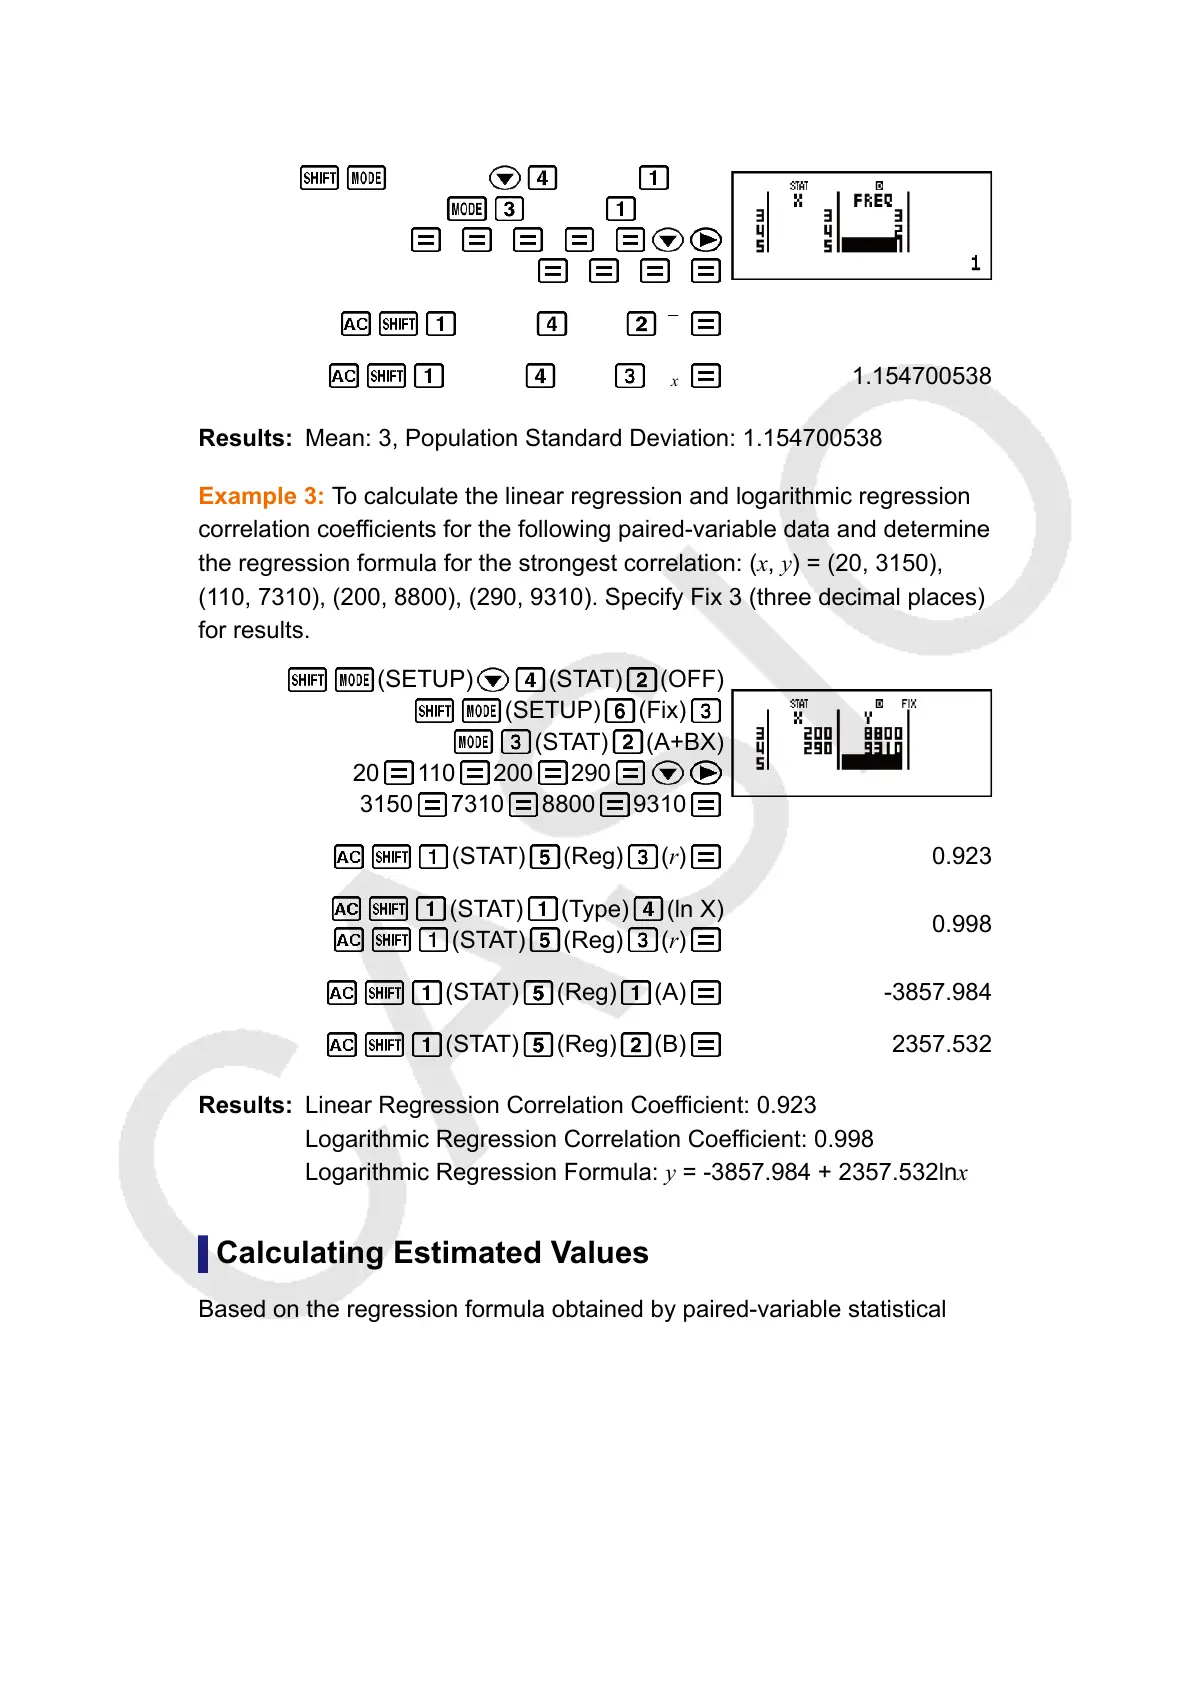
Mean: 3, Population Standard Deviation: 1.154700538
Example 3: To calculate the linear regression and logarithmic regression
correlation coefficients for the following paired-variable data and determine
the regression formula for the strongest correlation: (x, y) = (20, 3150),
(110, 7310), (200, 8800), (290, 9310). Specify Fix 3 (three decimal places)
for results.
(SETUP) (STAT) (OFF)
(SETUP) (Fix)
(STAT) (A+BX)
20 110 200 290
3150 7310 8800 9310
(STAT) (Reg) (r)
0.923
(STAT) (Type) (ln X)
(STAT) (Reg) (r)
0.998
(STAT)
(Reg) (A) -3857.984
(STAT) (Reg) (B) 2357.532
Linear Regression Correlation Coefficient: 0.923
Logarithmic Regression Correlation Coefficient: 0.998
Logarithmic Regression Formula: y = -3857.984 + 2357.532lnx
Calculating Estimated Values
Based on the regression formula obtained by paired-variable statistical
calculation, the estimated value of y can be calculated for a given x-value.
The corresponding x-value (two values, x
1
and x
2
, in the case of quadratic
regression) also can be calculated for a value of y in the regression
formula.
Example 4: To determine the estimate value for x when y = -130 in the
regression formula produced by logarithmic regression of the data in
48