18
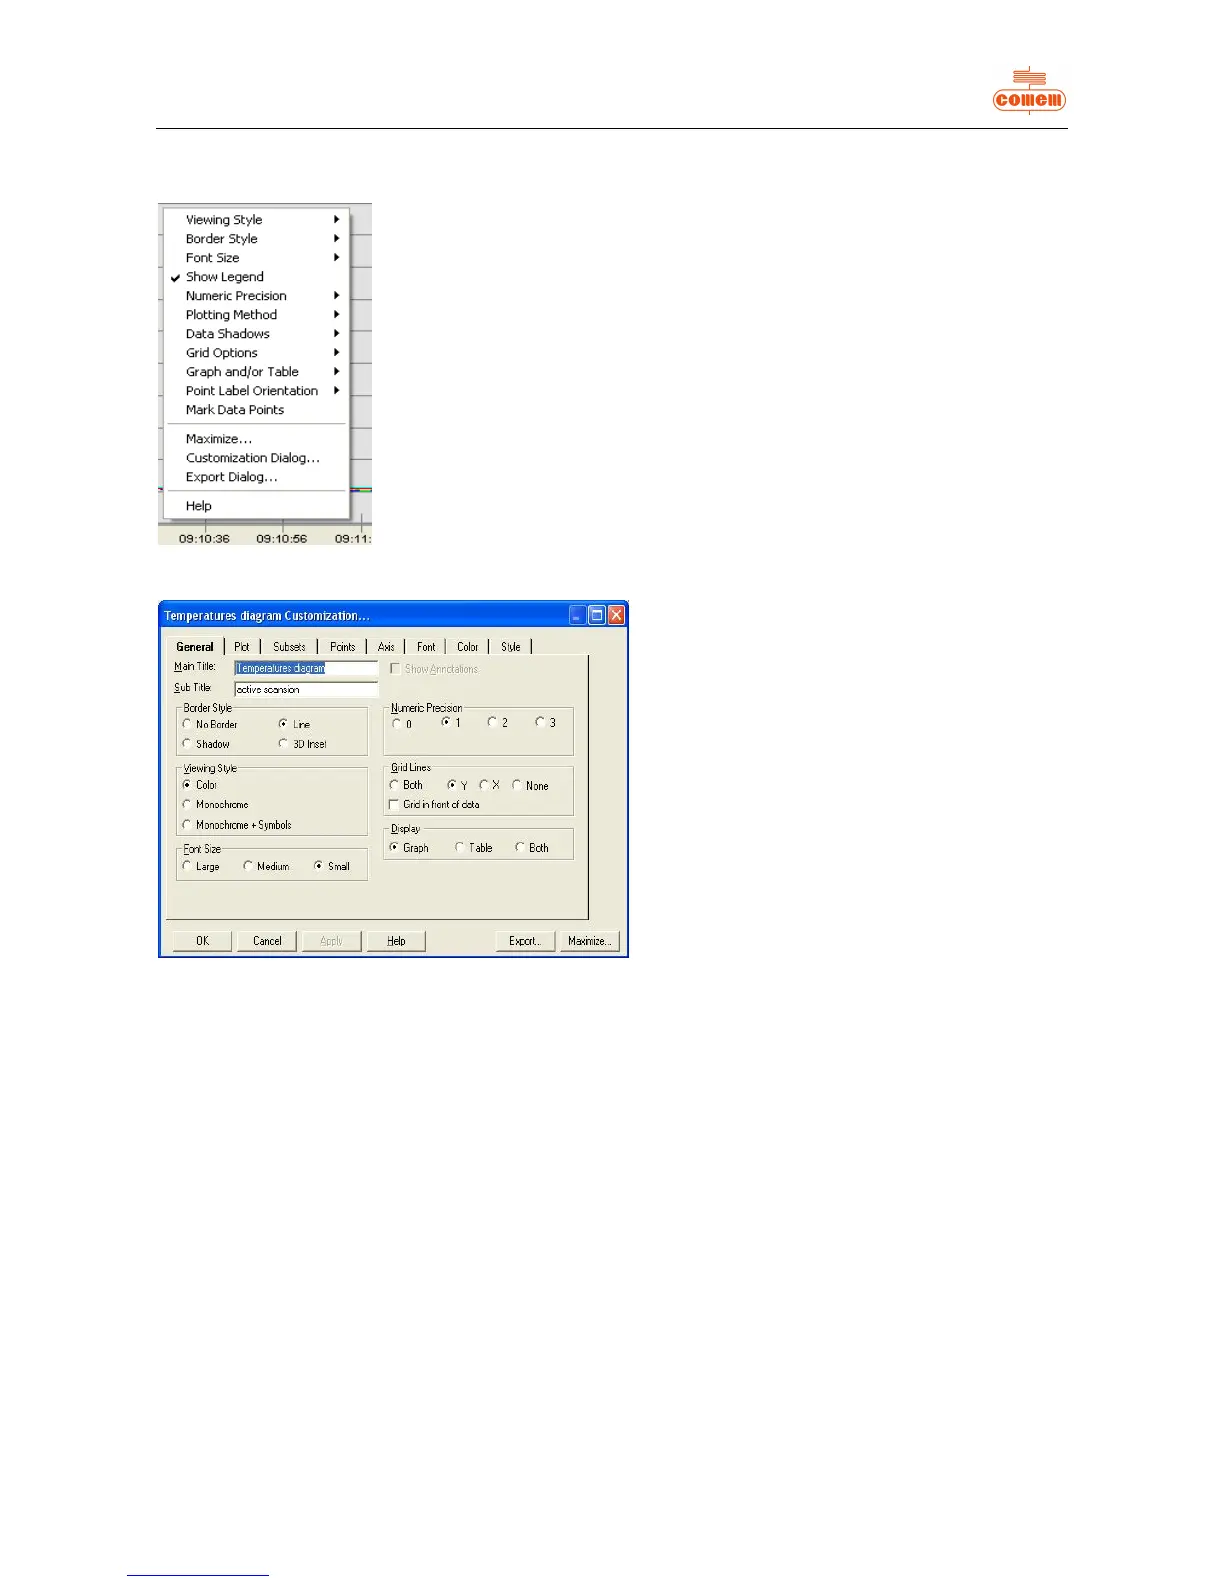
Click with the right key of the mouse when on the graph area to display the dialog window and change the parameters (fig. 16).
Fig. 16
Fig. 17
The main functions are as follows:
· Viewing Style: to change the colours of the graph
area;
· Show Legend: enabled if graph legend is ticked;
· Plotting Method: allows you to choose the mode
with which the temperatures on the graph are
displayed (histograms, lines, dots, etc...);
· Maximize: zooms the graph area;
· Customization Dialog: allows you to access a
dialog mask (fig. 17),
where you can:
Ø enable or disable the channels displayed
in the graph area (Subsets)
Ø change the number of points shown in
the graph area (Points)
Ø change the scale of the y-coordinates
(linear or logarithmic) and the
temperature range (Axis)
Ø change the colours and types of lines
and points (Style)