17
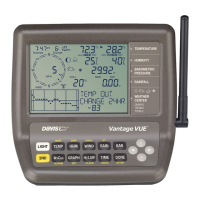
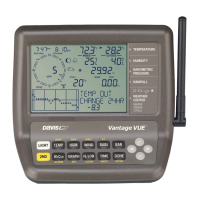
To view highs and lows:
1. Press HI/LOW. The time and date of the DAY HIGH for the currently
selected weather variable, along with a graph showing the highs for the
last 25 hours, days, months, or years is displayed.
2. Select a variable.
3. Press HI/LOW or + or - to scroll between:
Day Highs Day Lows
Month Highs Month Lows
Year Highs Year Lows
The time and date changes as you move between the various highs and
lows. (NOTE: Not all highs and lows are available for all weather variables.
See Vantage Vue Console Manual for details.)
4. Press ( < ) or ( > ) to scroll through the dots on the graph. The time and
date will change and the corresponding dot on the graph will flash. Press
DONE to exit the HIGH/LOW mode.
Highs & Lows
 Loading...