25
Diagnostic
Screens
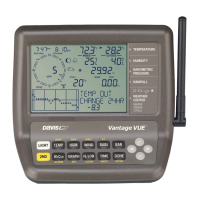
To Display the Console Diagnostic Screens:
Press and hold TEMP then press HUM to display the Statistical Diagnostic
Screen.
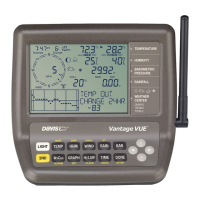
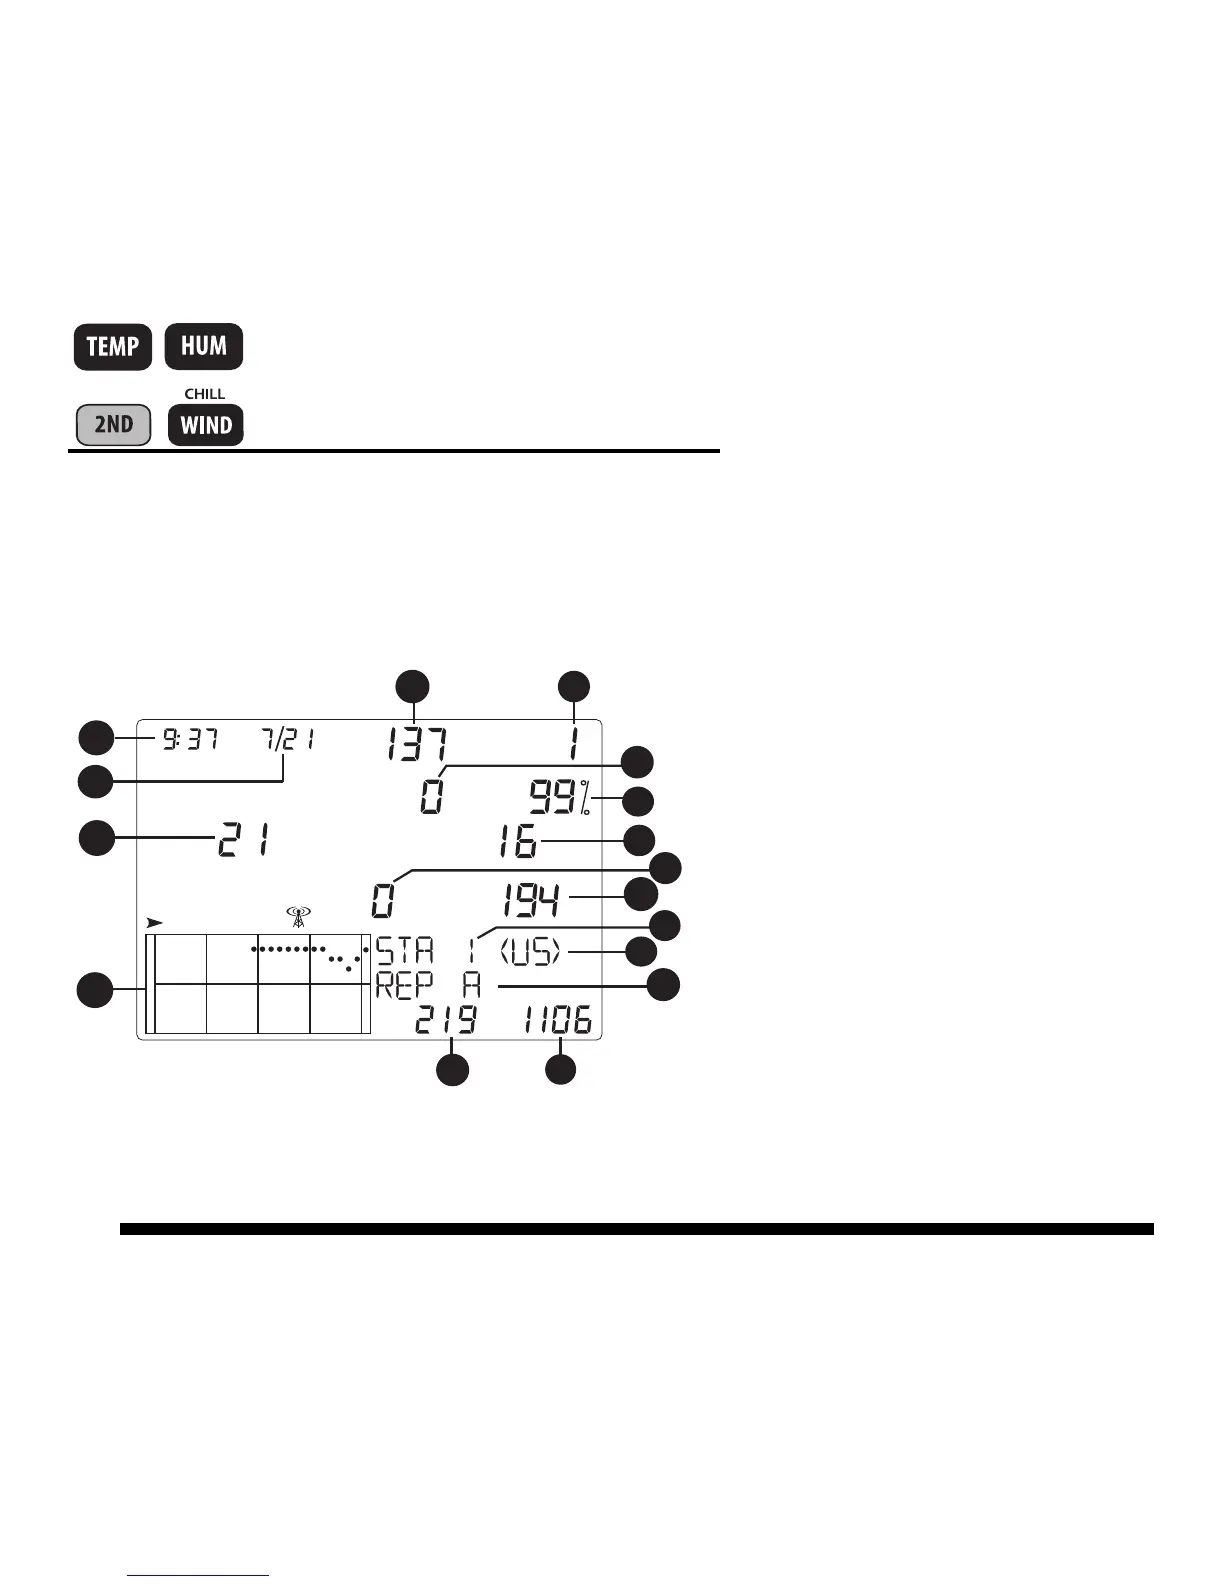
Statistical Diagnostic Screen:
1. Time or number of closed
anemometer reed switch*
2. Date or number of open
anemometer reed switch*
3. CRC errors
4. Firmware version
5. Longest streak of bad packets
6. Console resynchs
7. % Good packets
8. Total bad packets.
9. Current streak of bad packets
10. Current streak of good packets
11. Station number
12. Transmitter domain
13. Repeater ID
14. Total good packets received
15. Longest streak of good packets